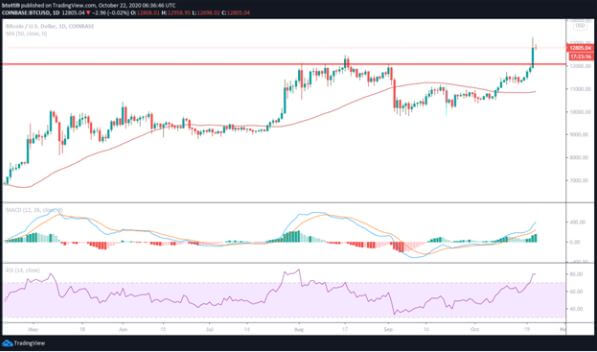
BTC/USD price rose from $12,300 to $13,250 to continue recent uptrend and was up by 78% YTD
Bitcoin price continued its stellar performance this week, first rising to register the price of $12,300 and then spiking to a 15 – month high above $13,200.
While the uptrend was expected, the swift jump to intraday highs around $13,250 still appears to have caught many completely off guard. News that PayPal would allow its 386 million+ users to use Bitcoin played a big role in the upside.
It is the first time since July 2019 that Bitcoin’s price had climbed above the $13K mark. In 2020, it’s the highest level the top cryptocurrency has achieved. At the time of writing, BTC/USD is 12.4% up this week, more than 20% this past month and nearly 79% year – to – date.
Notably, the top cryptocurrency continues to extend its record stay above $10,000, now at 88 days and counting.
Bar a catastrophic crash, it’s likely that Bitcoin’s new bull run will soon take out the $14,000 level than retrace to $10K.
BTC/USD technical outlook
From the intraday highs, increased volatility helped push Bitcoin price to lows of $12,600. Bulls are, however, showing resilience and have pushed prices back above $12,800.
BTC/USD broke multiple resistance levels in rising to highs of $13,350 from intraday lows of $12,300. The key level was $12,500, above which is a resistance turned support area around $12,700. Breaking above the SMA100 on the hourly chart was key to BTC/USD racing to its 2020 high.
But a sharp sell – off plunged BTC/USD more than $600 to see it touch $12,600 lows. Bulls have shown increased strength though and prices are back above the $12,800 level. The hourly chart suggests strong bull presence near the $12, 650 support zone which is critical to preventing further downsides.
At the time of writing, Bitcoin is trading above the trend line near the 50% Fib retracement level. This is critical if bulls are to push higher towards $13,000.
Should the pair break above this level, a retest of $13,250 will likely be followed by an attempt at the next major resistance level around $13,650. Above this level, an extended upside will likely bring the $14k level into focus.

The short term outlook, as seen on the daily chart above, has the MACD predicting a rising bullish momentum. The RSI also remains perched in the green despite being ever so slightly flat. As long as the price stays above $12,600, bulls will hold the upper hand. Beneath this level, the SMA 100 provides immediate support above $11,900.

