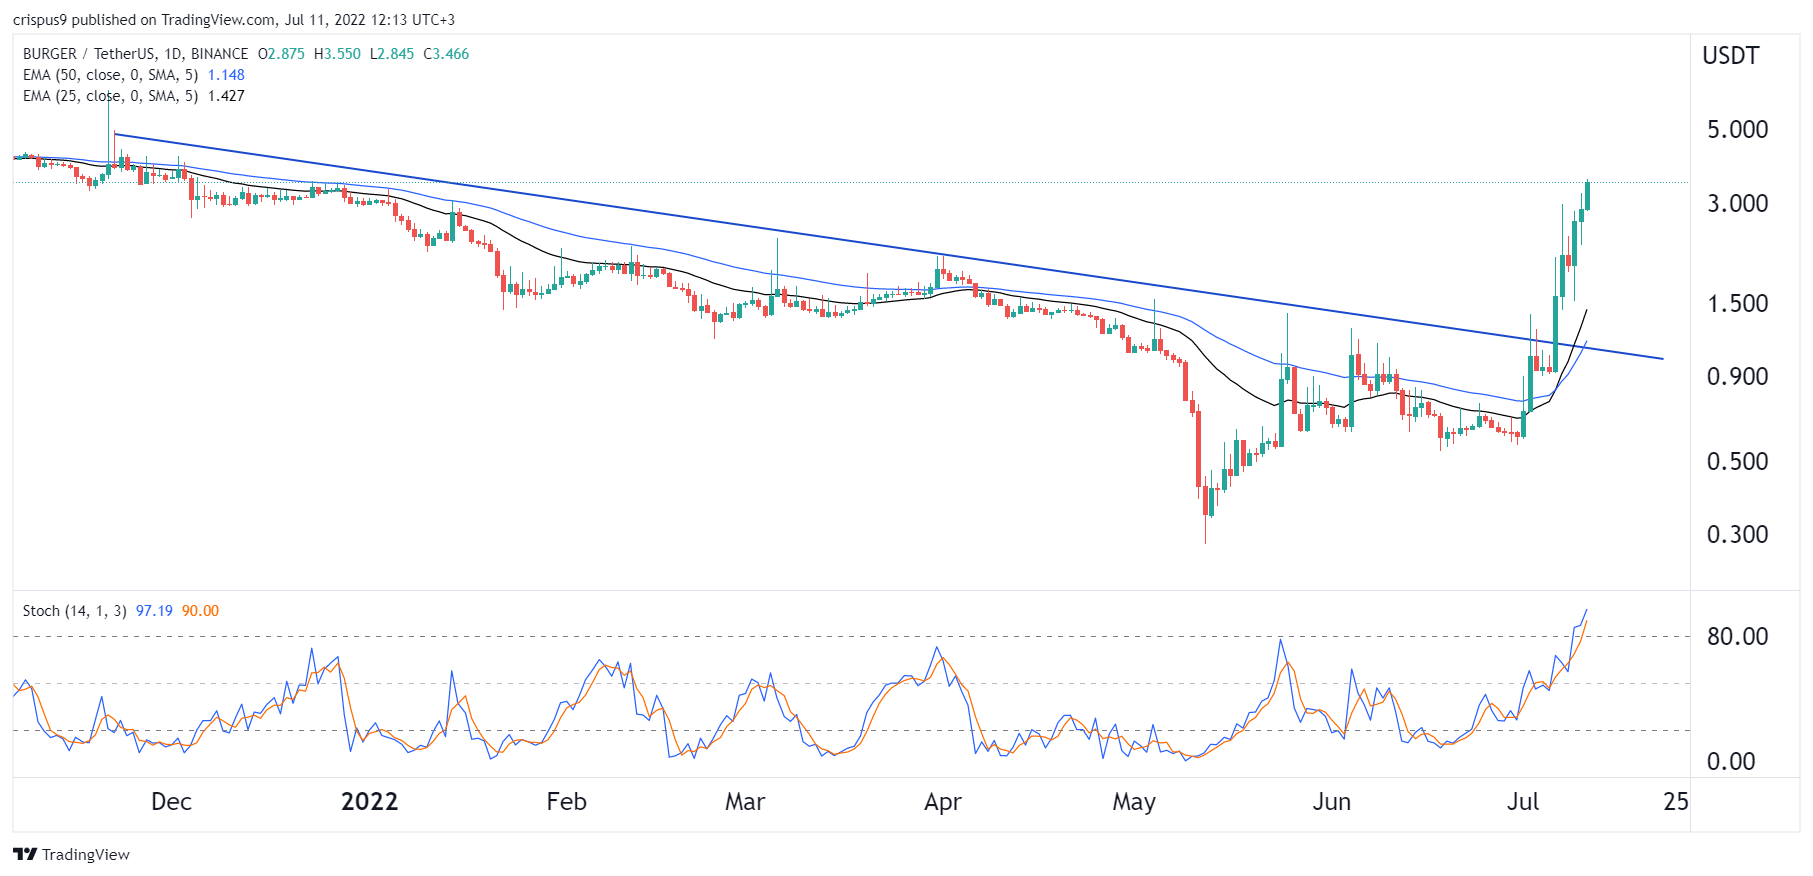
The BurgerCities price has gone parabolic in the past few days as demand for the coin jumped. BURGER rose to a high of $3.45, which was the highest level since December. It has jumped by more than 1,100% above the lowest level this year, bringing its total market cap to about $12 million.
What is BurgerCities and why is it rising?
BurgerCities is a relatively small cryptocurrency that was created in the BNB Chain ecosystem. It is a platform that combines both the metaverse and decentralized finance (DeFi). It is a gaming platform where people compete for rewards. As such, it describes itself as a MetaFi.
In the BurgerCities ecosystem, people can engage in casual activities like gaming and socializing with the goal of earning rewards. As a metaverse project, it has also integrated the concepts of non-fungible tokens. As such, like Axie Infinity, it is possible for one to make substantial returns by taking part in its gameplay.
Some of the most important parts of BurgerCities are the Black Market, which integrates a cross-chain aggregator of the major DEX and CEX protocols. There is also the energy plant where users can become liquidity providers and a central bank, which is the single-coin dual-mining revenue aggregator in the network. It is also possible for one to buy virtual property in its ecosystem.
The BurgerCities price is rising as investors react to the recent integration of iZUMi into their aggregation protocol. The partnership came after BurgerCities launched its aggregation protocol. Therefore, the number of DEXs in the ecosystem are MDEX, Biswap, BakerySwap, and Babyswap among others.
Another reason why the BURGER price is rising is that of pump and dump among market participants. In the past few weeks, we have seen the number of such schemes rise.
BurgerCities price prediction

The BURGER price has made a strong recovery in the past few days. On the daily chart, it has managed to move above the descending trendline shown in blue. It has also jumped above the 25-day and 50-day moving averages while the Stochastic Oscillator has moved above the overbought level. The same is true with other oscillators like the Relative Strength Index (RSI) and the MACD.
Therefore, I suspect that the coin will soon have a pullback as sellers target the blue trendline. This is known as a break and retest pattern. If it happens, the next key support to watch will be at $1.5.

