A breakout above a bearish trendline could trigger a new surge towards $1.50 from the key price level of $1.38.
Cardano (ADA) is up 2.62% in the past 24 hours, currently trading at $1.367 and looking for that little momentum that could elevate it to or past $1.40.
ADA/USD’s rebound follows a dip to lows of $1.28 last Friday, but resilience over the weekend has seen bulls reenergized, with today’s high formed near $1.378.
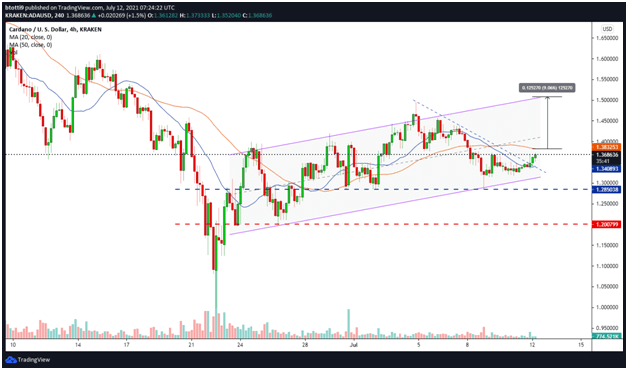
The 4-hour chart suggests further gains above a bearish trendline could see buyers target fresh movement towards the critical resistance level at $1.50. Traders might, however, need to note that ADA remains about -3% down on its weekly peak, and any downturn might feed a lingering bearish sentiment.
ADA/USD price outlook
Bulls face one more stiff resistance level before they retest the above-mentioned primary target. However, if the momentum fades, it could embolden bears to attempt a retest of $1.30 and 1.20.
On the 4-hour chart, ADA/USD has extended its gains above the 20-day simple moving average (SMA) at 1.341. The pair is also trending upwards within a rising channel after breaching a short-term bearish trendline formed on 4 July.
The Relative Strength Index (RSI) above 50 and trending with a positive divergence suggests bulls have the upper hand. A bullish continuation could thus see ADA rally over 9% in the next two days to target $1.50.
Despite the bullish outlook, the upside may yet face rejection at $1.40, even if bulls clear the previous support-turned-resistance level at the 50 SMA ($1.383).

If there’s a bearish flip to the 20 SMA and prices head to the lower trendline of the channel, fresh selling could trigger further declines to the horizontal support that marks 9 July lows near $1.28.
Below this level, ADA could fall to another horizontal line (red) at $1.200.
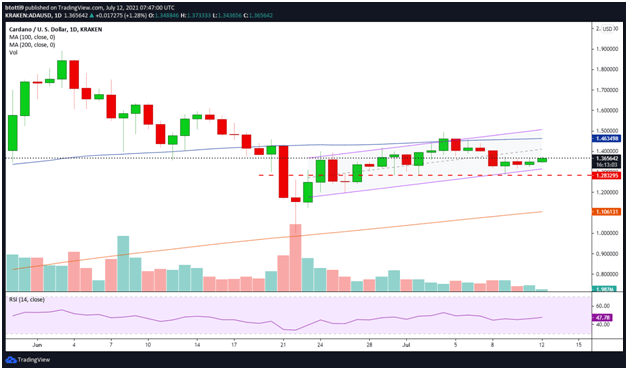
On the daily chart, the RSI is below the 50-mark to suggest bulls are not out of the woods yet. The lingering bearish outlook is also linked to the fact that ADA price is below the 100 SMA ($1.463).

The zone is the main hurdle if bulls break above $1.40, with a negative flip likely to push the price towards horizontal support at $1.283. The main support zone is at the 200 SMA at $1.106.

