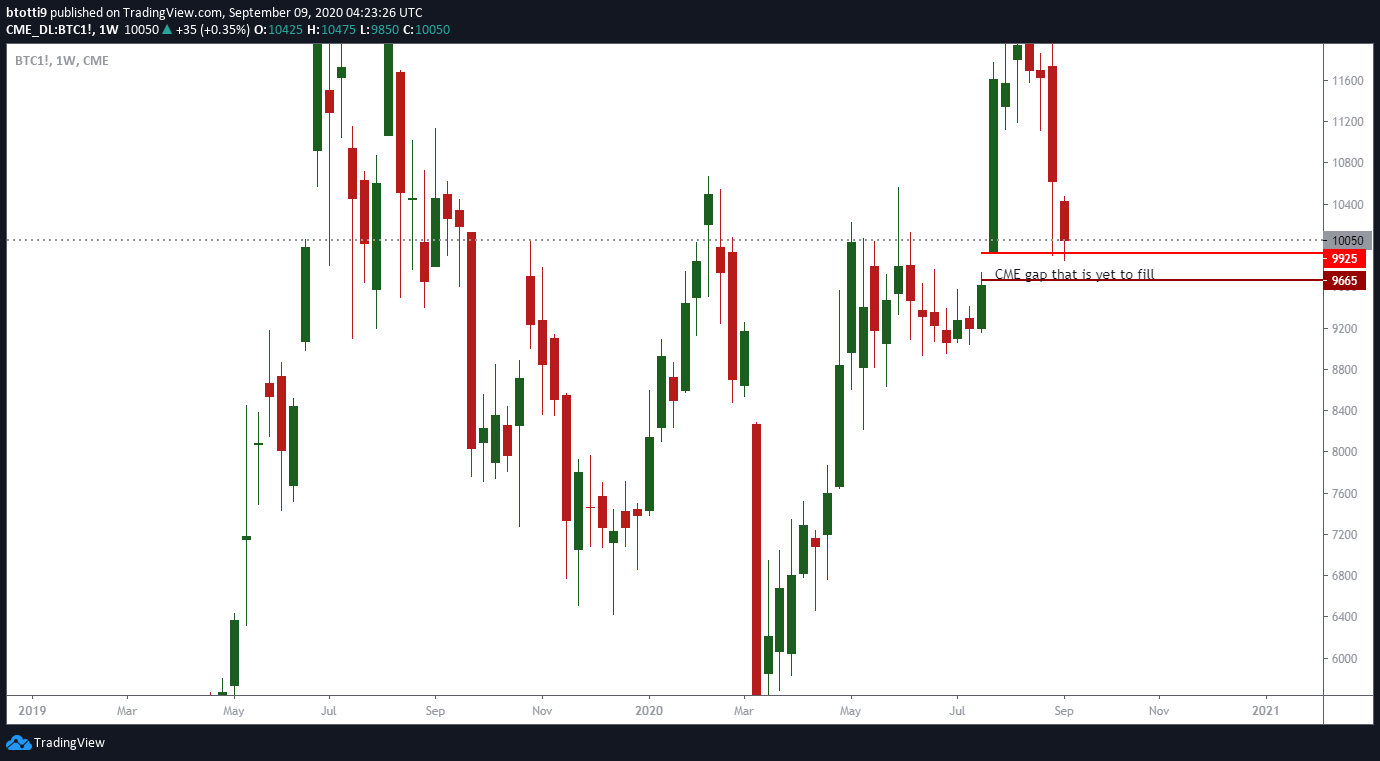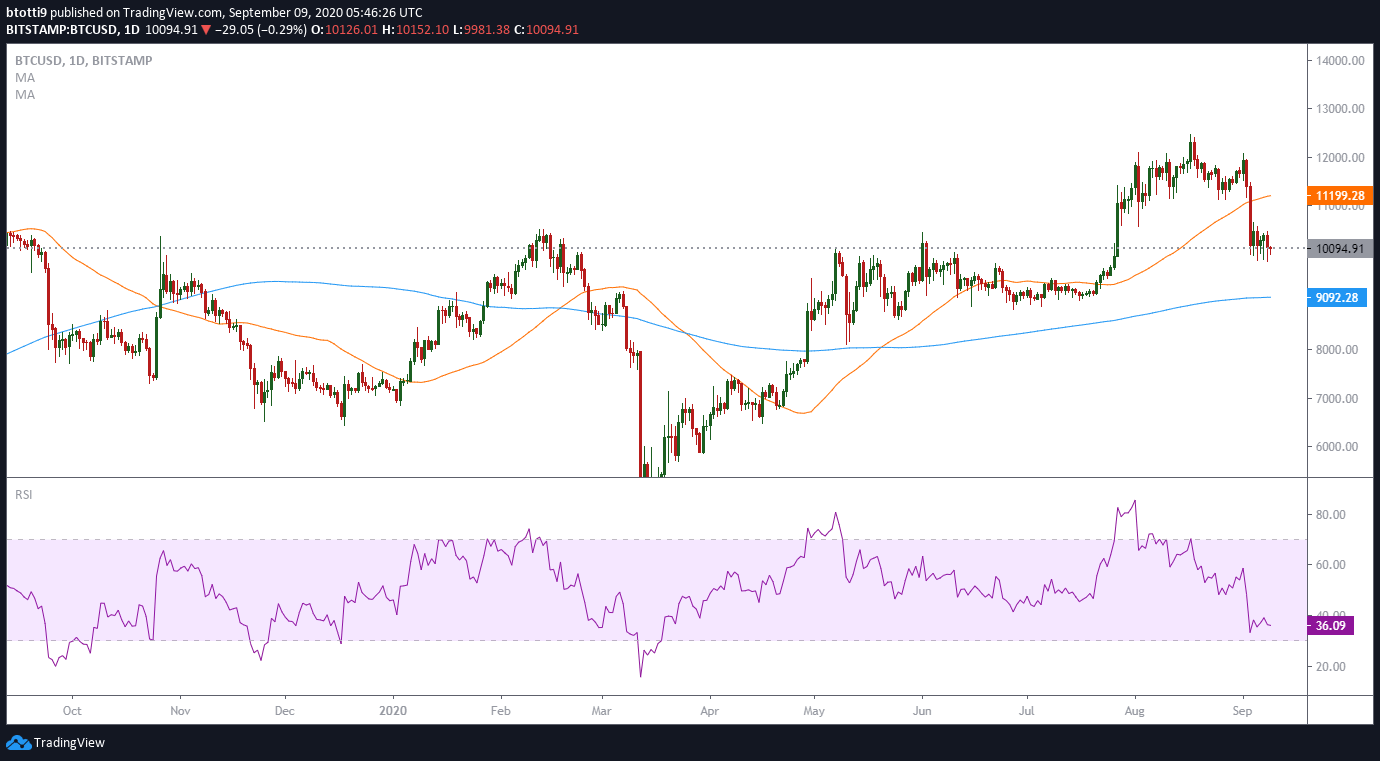
BTC/USD dropped to lows of $9,850 before bulls vigorously defended the important $10,000 peg
Bitcoin continues to hold the $10,000 support area despite a late Tuesday dip that took prices below $9k and saw investors brace themselves for a retest of prices near $9,700.
A pullback from highs of $12,400 to lows of $10k is not at all surprising given historical price action. However, the drop happens alongside a broader retracement in the equities market, especially with tech stocks that have continued to plunge over the past week.
However, it’s not just the bitcoin-stocks correlation factor analysts are looking at here. There’s something called a CME gap, which is the difference in price at close on Friday for the conventional CME Futures exchange and where markets open when trading resumes.
Since BTC/USD trades happen around-the-clock, gaps may appear if the price shoots or falls over the weekend.
Historically, Bitcoin’s price has retraced 95% of the time in the days and weeks after a gap to “fill” it. The latest such gap appeared when BTC/USD raced to highs of $10,000 on the weekend of July 25-26 after the derivatives marketplace closed on July 24, with the top cryptocurrency trading around $9,665.

Bitcoin bulls defend $10k
Despite yesterday’s dip taking Bitcoin to lows of $9,850, bulls aggressively bought the dip during the Asian trading session. BTC/USD shot back above $10k after bears staged an unsuccessful attempt around $9.9k.
Bitcoin has printed higher lows and lower highs on the 4-hour charts, currently trading around $10,100. If bulls hold the support level and prevent a retreat to 24-hour lows, BTC/USD could aim for another leg up.
The psychological $10,500 provides the next major hurdle, with further upsides likely to face seller rejection at 50-MA around $11,199.

On the downside, a leg down during the European and US trading sessions could see bulls forced to defend $9,800 again. If the level falls to the bears, an oversold RSI would accelerate the dip to the $9,800-$9,700 level. Beneath this area, bears could aim for the 200-MA on the daily charts at $9,092.

