ATOM price is up nearly 10% as strong performance and Coinbase staking rewards likely to push it beyond $5.77
ATOM/USD is changing hands around $5.41, up by more than 9% in the past 24 hours and over 30% in 7 days. The token thus is continuing a strong recovery from lows of $3.80 reached on September 23 continues.
As of writing, Cosmos’ native token is likely to post further upsides given Coinbase’s announcement that ATOM now joins Tezos as the only staking coins on the exchange. As such, holders of the token can now stake and earn an APY of up to 5% to be paid out weekly (every 7 days).
According to the San Francisco-based cryptocurrency exchange, the offering is accessible to Cosmos holders in the US, UK, France, Spain, Belgium and Netherlands.
It’s not certain that ATOM/USD will pump higher on this news. If it does on a confluence of indicators, then a breakout to the upside could see it touch prices near an all-time high at $8.60.
ATOM/USD technical indicators
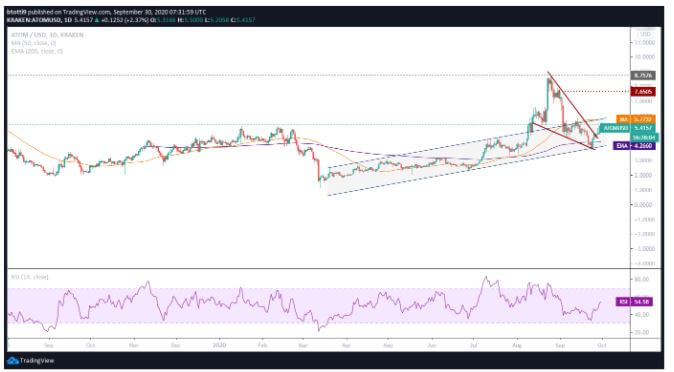
The last few days have seen Cosmos’ price break above the upper line of a falling wedge pattern, a historically bullish indicator. An upside that clears the wedge is conventionally as high as the pattern’s height and in this case, suggests further gains are likely.
Notably, the token has maintained an uptrend above the upper limit after being capped within the converging trendlines for over a month.

Apart from the Falling Wedge, another technical indicator for ATOM/USD is the Ascending Channel, whose lower limit provides a support area and is in line with the base of the pattern.
As can be seen in the daily chart above, ATOM/USD is trading higher and could test resistance at the upper line of the ascending channel. This area provides the only major hurdle established at the 50 MA at $5.77, beyond which buyers have ample room to maneuver.
If validation of the pattern breakout and a retest of the resistance at the upper channel line does occur, the next rally could take ATOM/USD to highs of $7.65. In that case, bulls will have pushed higher by around 45% from current price levels.
The RSI is northbound to suggest the advantage is with the bulls. Meanwhile, the 100 EMA and the lower limit of the channel provide immediate support near $4.2 and $4.00 in case of a strong rejection near the 50 MA.

