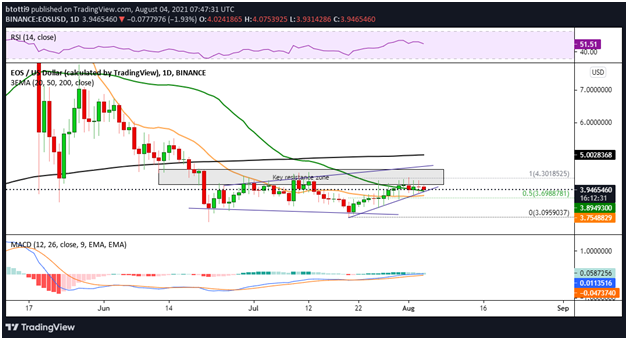
The technical picture suggests bulls will struggle if the price breaks below the 20 EMA and 50 EMA
EOS price is up 0.3% in the past 24 hours and the coin presently trades around $3.98, down 0.5% in the past hour.
EOS reached its all-time high of $22.71 on 29 April 2018, and despite a recent surge to above $14, the cryptocurrency has largely underperformed since its market debut. According to data from CoinGecko, today’s price is roughly 82.5% lower than its ATH.
With the broader market also in a slowdown, the cryptocurrency is facing a potential retracement that could take it further away from the peak.
EOS price outlook
The daily chart shows prices have turned lower after indecision crept into the market following a rejection around $4.30 earlier in the week.
The recovery from $3.79 also faded at $4.22, making the region around $4.10 to $4.56 a critical supply zone. There was a Doji candlestick on 3 August and the price has traded lower, with intraday moves oscillating in the region below the round figure of $4.00 and the 50-day exponential moving average at $3.90. 
EOS/USD daily chart. Source: TradingView
Looking at the technical indicators, we see the daily RSI beginning to dip, though it remains above the equilibrium point. The MACD is also providing a bullish view, but it is decreasing in strength as shown by the histogram.
If bulls manage to keep bears off and achieve a daily close above the 50 EMA, the EOS/USD pair could continue along the ascending trendline formed with the recovery from lows of $3.10. The uptrend could see bulls break the key supply zone marked on the chart and target the 200 EMA at $5.
On the downside, the price could find vital support at the aforementioned 50 EMA and then the 20 EMA at $3.75. Support beneath these levels lies at $3.70, which is at the 50% Fibonacci retracement level of the move from $3.10 to $4.30.
A breakdown from here would take prices towards $3.

