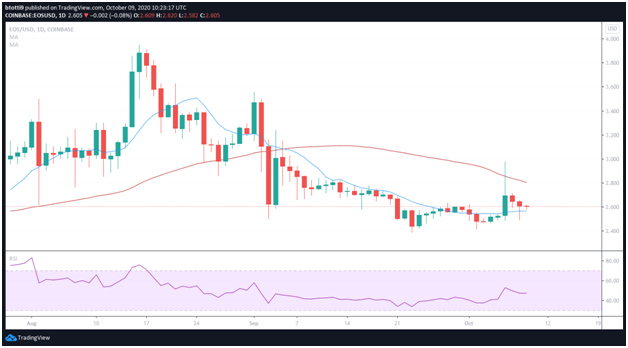
The 14th largest cryptocurrency by market cap EOS rallied to highs of $2.97 but has dropped to lows of $2.57
EOS is trading just above a long term resistance line after bulls failed to hold gains achieved via a 20% breakout on Wednesday.
EOS price hit the previous local high of $3.95 in mid-August. However, the movement has been capped along a descending resistance line.
As of writing, EOS/USD is changing hands around $2.60, down from the highs of $2.97 reached on October 6. At the time, the 14th ranked coin surged from lows of $2.48, with bulls appearing to have the momentum to take them above $3.00.
But the break above a descending resistance line that has been in place for over five months did not hold for long either. Despite the 20% breakout, sellers pushed hard to have EOS/USD end the trading day with a daily candlestick that only featured an extended upper wick.
The past two trading sessions have seen EOS print a series of lower highs and lower lows to move closer to $2.50. This area is critical to bulls’ plans as it is the next major barrier to a downward trend towards the $2.45 zone that has resisted multiple bear attacks since April.
EOS/USD technical perspective
The technical outlook for EOS is suggesting a bullish scenario remains when charted on the daily time-frame. The daily chart features an upside looking Stochastic Oscillator with a bullish cross, whereas the MACD is also forming a bullish divergence just under the midline.
If buyers push above $2.70, its likely EOS price could rally to retest $2.90. Managing to turn this resistance zone into support is just what bulls may need to attempt to breach the $3.50 line.

While EOS/USD is about 1.5% in the green on the day, it is showing some weakness on the hourly time frames. Price is below both the 10-day and 50-day simple moving averages on the 1-hour chart, while the RSI, as seen in the hourly and daily time frames, remains within the neutral zone.

