Ethereum’s price remains on course for another leg up after hitting highs of $408
ETH/USD rose sharply from lows of $385, breaking a major resistance line at $395 to briefly trade at a new peak around $408.
Although the asset traded as low as $395, keeping it above the critical support area mentioned below means that the bulls will retain the advantage and are set to attempt a breakout above $410.
ETH/USD technical analysis
From a technical perspective, ETH/USD is likely to fluctuate between key support and resistance areas around $400. However, fresh buying pressure will provide the impetus bulls need to push higher as ETH 2.0 inches even closer.
Bulls also face relatively little resistance above the $400 line, with the next rally likely to see Ethereum test the area around $425.
No hurdles for ETH/USD above $400
To retain the positive outlook, Ethereum needs to hold above $395 and aim for a higher close near $400. If the bullish momentum continues, a flip of the supply barrier around $400 into support would give bulls the base they need to push higher near term.
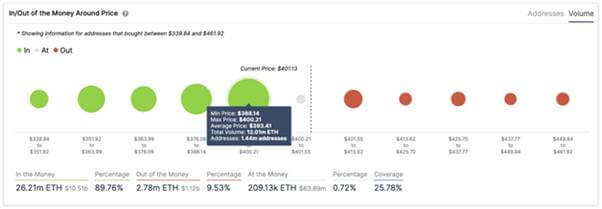
IntoTheBlock’s In/Out of the Money Around Price (IOMAP) metric suggests holding the ETH/USD price above the supply barrier-turned-support area is critical. As per the IOMAP chart below, there is a relatively clear path to $470 if the above scenario plays out in the coming days.

If bulls maintain the upside momentum and ETH price prints a higher daily close, the positivity expected around the crypto market could help ETH/USD climb higher. Such an outlook would become even clearer if there is an influx of fresh buying pressure.
As noted above, this outcome could open up a clear path to $450 and then to $470.

Should the move to higher levels fail, several support areas are likely to prevent a massive dump in the short term.
The 50% Fib and 38.2% Fib retracement levels of the downswing from highs of $404 to $370 low provide support at $387 and $383. Further downsides should see the 23.6% Fib retracement level offer another cushion at $381.
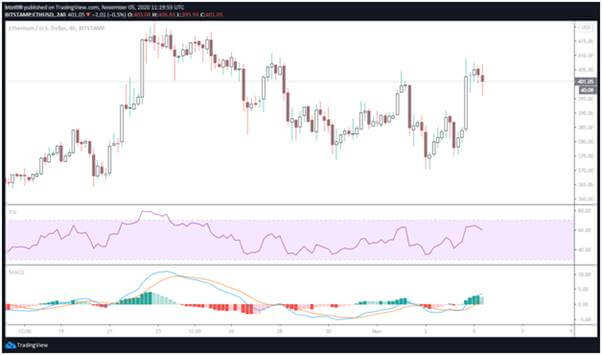
The MACD on the 4-hour chart for the ETH/USD pair is also in the bullish territory but features a hidden bearish divergence. The RSI has also begun to slope and is currently printing 59.20.

