


ETH/USD currently trades within an ascending triangle pattern and could see a breakout to highs of $770 by end of December
Ethereum price could surge to highs of $750 within the next two weeks if bulls breach a major resistance level. The smart contracts platform could also see the value of the native digital asset spike by 25% or more given historical price action over December months.
At the time of writing, Ethereum price is trading around $583, about 2% down on the day. Bulls are battling downward pressure within a critical technical pattern, a scenario that could prove pivotal to the short term plans for both bulls and bears.
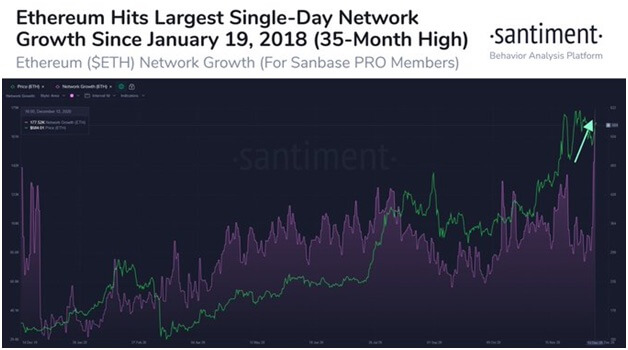
ETH network growth
The stalling of ETH/USD near $583 comes as on-chain data from analytics firm Santiment suggests bullish sentiment with respect to a new daily active address record.
According to the firm: “The number of new Ethereum addresses hit a single-day, 35-month high Saturday. Our network growth metric picked up ETH reaching 177.5k addresses created. Notably more addresses interacting on an asset’s network is a very promising indicator for bulls”.
The bullish breakout might also benefit more from the so-called Santa Claus price action. According to the historical aspect of this type of price rally, assets traditionally spike between 25 December and 2 January before bearish pressure pushes them down again in early January.
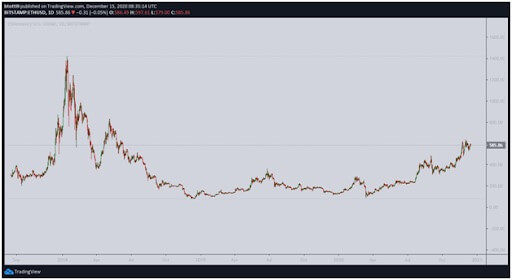
The Ethereum price chart above shows that the past two years have seen ETH/USD surge 11% and 25% during the Christmas week for 2018 and 2019, respectively.
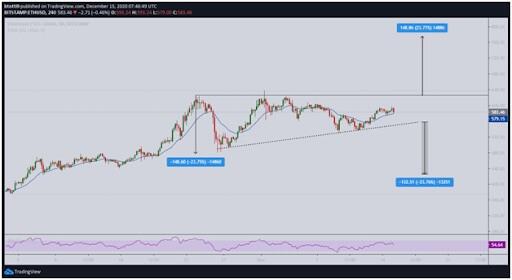
The 4-hour chart shows Ethereum price remains capped inside the month-long ascending triangle pattern. A breakout to the top of the triangle ($625) could aid bulls’ push for prices above $750. If bulls keep bears off and hold advantage above the 20-EMA, a potential rally to highs of $750 could see ETH/USD gain by more than 24%.
If bulls fail to defend the 20-EMA, Ethereum could drop to the lower trendline of the triangle pattern. The anchor level offers support at $570, with the next cushion available around $422.