Institutional interest and DeFi growth have driven ETH price in 2021, with the break above $4,000 coming just days after the cryptocurrency raced past the $3,000 mark.
Ethereum (ETH) has broken out above $4,000, reaching and surpassing the landmark price level during morning trading on 10 May.
As we highlighted last week, Ethereum’s surge above $3,000 was pegged on increased institutional interest. Data shows that most of the buying is happening on Coinbase as investors jump onto the ETH bandwagon.
Q: What's behind this $ETH parabolic move?
A: US (institutional) investors. https://t.co/4CvbSrF4tt pic.twitter.com/S24Dty4b0i
— Ki Young Ju (@ki_young_ju) May 10, 2021
The pace has also come from massive growth in the decentralised finance (DeFi) space, with TVL standing at around $86.38 billion.
So where does Ethereum go from here?
A pullback might be in the offing, but Crypto YouTuber Ben Armstrong suggests that looks “doubtful” at the moment.
Per the analyst, bulls have been unstoppable of late and the breakout above $4k means new price targets lie north of $5,000. The short-to-medium term outlook is also positive and Ether prices could rally as high as $10k by the end of the year.
Is Ethereum done? Doubtful. What prices are experts looking at?
Price targets and charts provided by my weekly series with @MMcrypto.https://t.co/erAfU7J0hA pic.twitter.com/IdjsZ1ciW9
— Bitboy Crypto (@Bitboy_Crypto) May 10, 2021
Ethereum price analysis
It’s been a huge week for ETH as the cryptocurrency records yet another milestone, after only recently breaching the $2,500 and $3,000 thresholds.
ETH/USD has surged 5% in the past 24 hours, with bulls keen on keeping the upside advantage. The increase follows a 12% spike over the weekend as the indecision seen on 7 May resolved upwards.
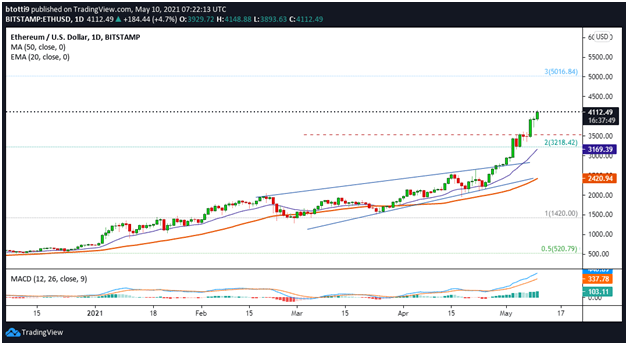
The cryptocurrency is now over 30% in the green this past week, with prices exploding above the 200% Fibonacci extension level ($3,218).
The technical picture for ETH/USD suggests further gains are possible. The daily MACD is increasing within the bullish zone, as is the RSI, which lies in the overbought territory. Both the 20-day EMA and 50 SMA lines are curving upwards to lend more weight to the perspective that the upside path offers the least resistance in the short term.
As seen on the below chart, there is an intraday high formed near $4,148 on crypto exchange Bitstamp. If bulls continue to push higher, a break above $4,500 could see Ether target the 300% Fib extension level ($5,016).

ETH/USD price daily chart. Source: TradingView
If traders book profits and a short-term pullback happens, ETH/USD might retest support at $3,500. The primary support line might be found at the 200% Fib extension level and then the 20-day EMA ($3,171). In the short-to-medium term, the main support zone is at 50 SMA ($2,421).

