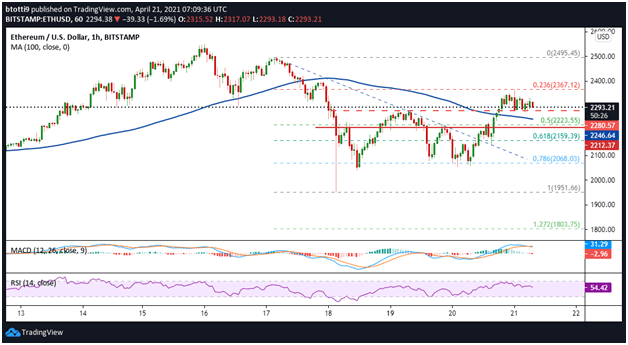
Ethereum has reclaimed support above $2,280, with ETH/USD trading above $2,360 after this week’s sell-off
The price of Ethereum against the US dollar is currently around $2,330. The cryptocurrency’s value has increased by about 9% in the past 24 hours, with weekly losses now down to 2%. As bulls seek to capitalise on market resurgence, ETH is perched above the key support line at $2,280. Buyers have even retested price levels at $2,365 as a symmetrical pattern formation appears on the hourly chart.
It appears upside momentum might take higher towards $2,400.
Ethereum price outlook
ETH/USD is above the 100 SMA on the hourly chart, which is critical to the bulls as they look to push higher. The breakout above the moving average came after buying pressure catapulted ETH above a bearish trend line formed when prices crashed from highs near $2,500 to lows of $1,950.
The pair is currently trading with increased bidding after the last hour closed with a Doji candlestick.
The likely upside above $2,300 could allow bulls to build momentum and target immediate resistance at $2,367. The barrier is presented by the 23.6% Fibonacci retracement level of the key decline from $2,497 to $1,951.
If bulls manage to break above this line, the next target could be $2,420 before another push takes it to recent highs of $2,500. From here Ethereum could seek a new all-time high above $2,550.

The hourly MACD remains positive and the RSI is above the middle line to suggest bulls hold the immediate advantage. A symmetrical triangle pattern is also materialising on the hourly chart, a continuation pattern that is likely to aid the upside push envisaged above.
In case of a downside flip, the first key support level is at the 100 SMA ($2,246). The 50% Fib retracement level of the aforementioned swing low provides the next cushion near $2,223, with further dips likely to be stemmed at the 61.8% Fib retracement level ($2,159) and 78.6% Fib level ($2,068).
A clear downward move below $2k will invite more selling pressure and allow bears to target $1,950 and then $1,800.

