Ethereum rose to highs of $395 before bulls lost steam to see it drop to $374
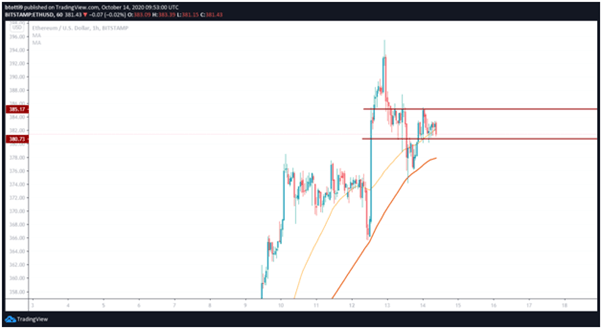
The last couple of days have seen the token trade lower after hitting a barrier at $395, with sellers’ attention sending it to lows of $380.
But the ETH/USD pair is likely to pick a new uptrend and revisit prices closer to the target if buyers breach the wall at $385.
Ethereum price analysis
ETH/USD flipped red with a series of lower highs and lower lows after its upside extension hit resistance around $395.44. The pair broke below the 50 hourly simple moving average and touched $374. The price has resettled above the 50-day SMA, the action adding to the comfortable support provided by the 100 SMA on the hourly chart.
The latter provides a base of support around $377, with a return of downside pressure likely to see bulls defend the aforementioned $374 area.
As of writing, ETH/USD is trending above the $381 line, near the 71.6% Fibonacci retracement level of the swing from $395.44 high to $374.19 low.

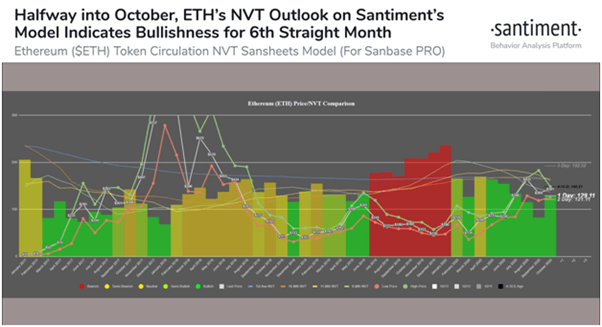
Ethereum’s NVT (Network Value to Transactions) Ratio shows that the cryptocurrency is likely to record a bullish divergence for the sixth straight month. The indicator measures an asset’s health in terms of circulation by dividing its market cap by its daily volume in US dollars.
According to the on-chain data platform Santiment, Ethereum’s bullish divergence has been positive for seven out of the past eight months. That period goes back to March 2020, when the cryptocurrency traded at around $134. Since then, then, ETH/USD has traded 187% higher.

If bulls clear the resistance at $385, also marked by the 50% Fibonacci retracement, the next target would be $390. Above this level, bulls would aim for $400.
On the downside, Ethereum price could decline first to support around $377, with a breakout below the weekly low opening up a potential drop to $367.
Looking at the hourly chart, the MACD’s hidden bullish outlook suggests bulls may struggle to form an upside in lower time frames. That picture is also strengthened by a flatlining RSI.

