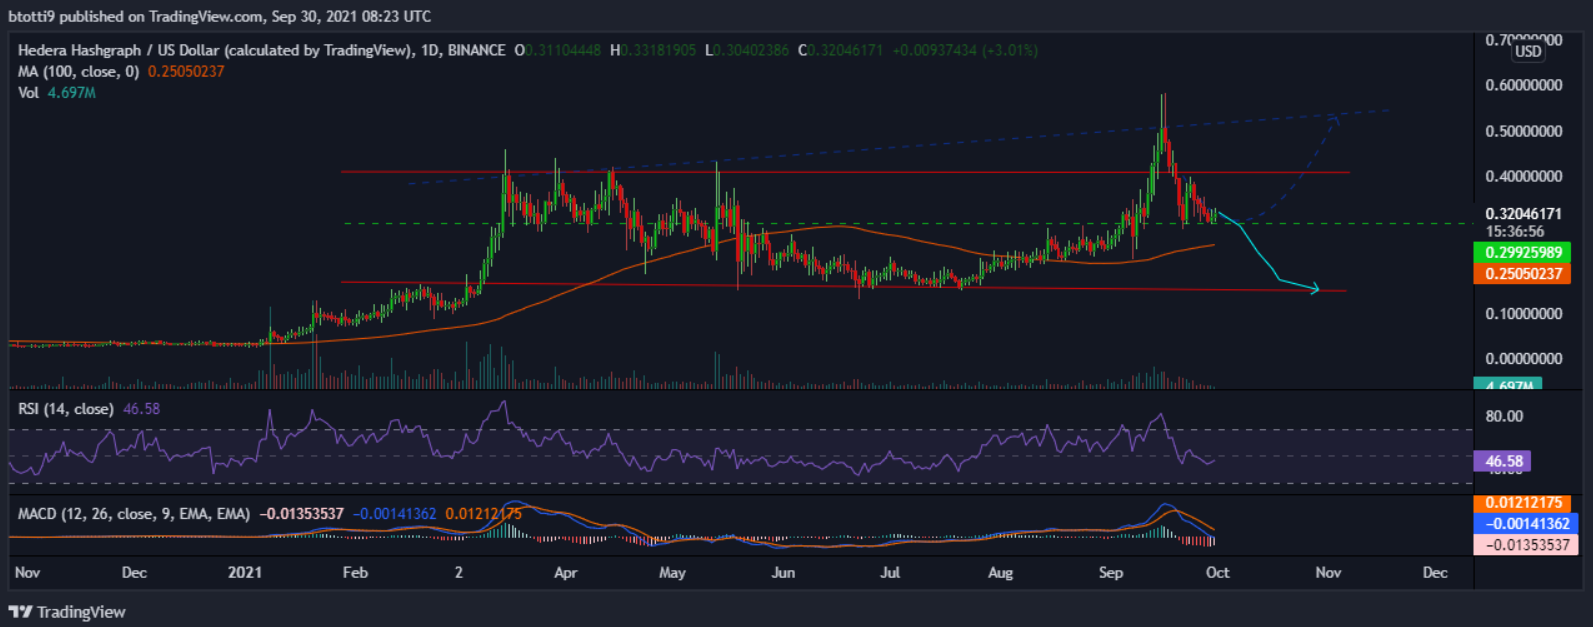
Bulls could push for a breakout to $0.35 and then rally as high as $0.53 if they hold prices above the $0.30 level
Hedera Hashgraph is trading around $0.33 at time of writing, as bulls battle to keep bears at bay following a brutal few days triggered by the widespread sell-offs seen in the market.
The price of HBAR is down nearly 44% over the past two weeks, a scenario largely accelerated by Bitcoin’s recent dump to lows of $40,000. This happened as investor sentiment took another hit while China continued its crackdown on crypto mining and trading.
HBAR price outlook
For Hedera Hashgraph price, the $0.30 to $0.35 zone is likely to interest bulls keen on recouping some of the losses. On the other hand, the area below the region presents legitimate targets for sellers.
The breakdown from the all-time high (ATH) of $0.57 came a couple of months after bulls had snapped a four-month downtrend. The upside saw HBAR/USD move from lows of $0.15 in mid-July to hit the ATH, before breaking lower to retest the old resistance-turned-support line near $0.30.
HBAR remains in an uptrend as seen on the daily chart, with the potential to flip higher still intact.
As long as prices stay above this line, an uptick above the main supply wall around $0.35 is likely to result in a bullish retest of $0.40 and then $0.53.
HBAR/USD daily chart. Source: TradingView
However, reduced volumes and a general reversal across cryptocurrencies could see HBAR price break below the main anchor at $0.30 to retest bulls’ resolve near the 100 SMA ($0.25).
While such a dip provides an opportunity for investors to buy the dip, the bearish view will strengthen if the 100 SMA demand zone is lost. This perspective is currently being aided by an RSI below 50 and a MACD indicator sporting a bearish crossover and likely to strengthen in the negative zone.
If the $0.25 zone falls into bearish hands, a bout of panic selling could trigger fresh losses with HBAR/USD likely to retest $0.15.

