IOTA has lagged behind major altcoins but could pick up momentum in the next few days to retest prices last seen in mid-April
MIOTA failed to rally in the immediate aftermath of the highly anticipated Chrysalis network upgrade. It is still early days for the upgrade, especially with more adoption expected for the production-ready and now largely decentralised network.
After reaching highs of $2.30 on 28 April, the cryptocurrency’s price has traded lower to align with a general downtrend not seen since it topped out at $2.73 in mid-April.
While Dogecoin (DOGE), Litecoin (LTC), and Chainlink (LINK) are lighting up the altcoin market with double-digit gains, IOTA is showing subtle signs of following suit. The digital asset’s price is hovering around $1.94, even as the technical picture suggests bulls are ready to refresh gains above $2.00.
IOTA price analysis
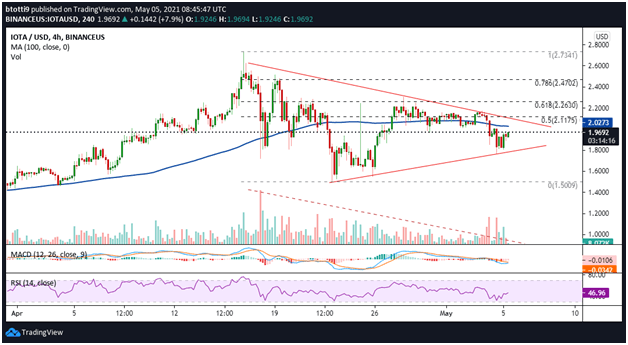
IOTA has been trading within a wedge pattern since its downtrend from $2.73, with the price recently consolidating near the upper trend line. However, a decline seen on 3 May dragged prices lower. This included a swing below the 100 SMA before a swift rebound off the bottom of the two converging trend lines near $1.75.
A peek at IOTA’s technical picture shows that volume has begun to pick up after declining over the past two weeks. The MACD is suggesting a bullish divergence, while the RSI indicator suggests momentum is shifting towards the bulls even though the pointer remains below the equilibrium level.

IOTA/USD 4-hour chart. Source: TradingView
The chart pattern suggests IOTA is in for either a breakout or breakdown. If buyers take control in the short term to push MIOTA above the 100 SMA ($2.02), a surge to the 0.5 Fib level ($2.11) would suggest a breakout is materialising.
In this case, IOTA/USD could rally towards its recent peak at $2.73 and then onwards to $2.80.
A contrary picture will appear if bulls fail to break above $2.00. This is likely to encourage sellers to target the pattern’s lower trend line near $1.80. A bearish flip from this support zone could send the price towards lows of $1.50.

