IOTA price could drop to lows of $0.23 if bears tighten their grip on short term action in the current phase of crypto sell-off
IOTA is trading lower on the hour, mirroring the negative trend engulfing the majority of the crypto market.
At the time of writing, IOTA is trading around $0.30 and is down more than 5% in the past hour. Overall, the 29th ranked cryptocurrency is looking like it will slip lower if the downward pressure holds.
However, if the bearish signals fail short term, a rally to $0.45 and higher will be possible.
IOTA/USD
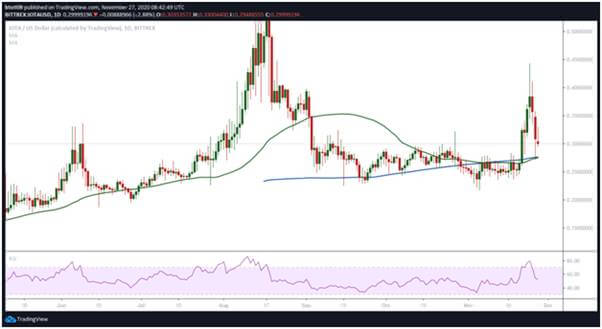
The technical picture for IOTA on the daily and 4-hour charts suggests bears are refusing to give bulls any chance. The setup is largely bearish and will spell doom if prices drop below a major support level indicated by the 50-day and 200-day simple moving averages.
After breaking above a multi-month horizontal resistance line around $0.30, follow-through action catapulted bulls near $0.45. But their joy has been short-lived as bears pushed back to plunge IOTA/USD to around $0.27.
 IOTA/USD daily chart. Source: TradingView
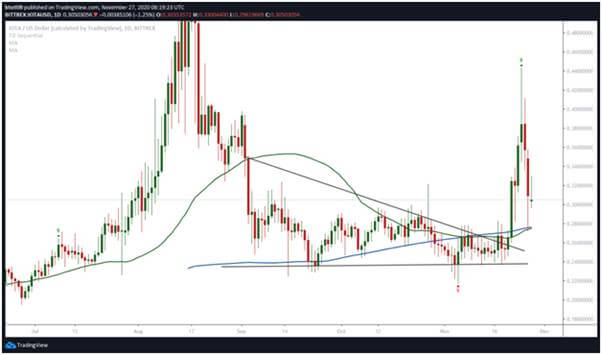
The daily chart features a green nine candlestick of the TD Sequential, which suggests bears are likely to continue with their plans to sink prices further.
The Relative Strength Index also suggests bears are building a downside momentum. The indicator has bounced off overbought territory and is close to the midline. If the path to the oversold region proves the easiest one, IOTA/USD could dip to lows of $0.23.
 IOTA/USD daily chart. Source: TradingView
As can be seen in the daily chart, the recent breakout above a descending wedge pattern offered bulls a chance to retest the $0.45 area. But the bullish reversal highlighted by the wedge pattern will not hold if the sell signal reinforces increased sell-off pressure.
To prevent a retest of the lower trendline of the aforementioned pattern, bulls need to keep prices above the 50-SMA and 200-SMA (daily chart).
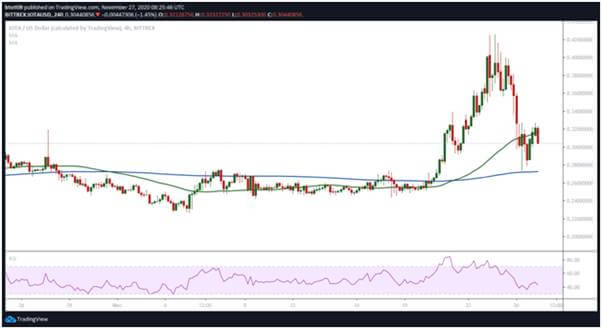
The 4-hour chart suggests bulls have a fight on their hands as the price has crossed below the 50-SMA and a dip to the 200-SMA will cement the bearish outlook. The next support levels, in this case, would be at $0.21 and $0.19.
 IOTA/USD 4-hour chart. Source: TradingView
However, a surge in buying pressure for IOTA coupled with a decent run for altcoins, in general, could hand bulls the chance to invalidate the bearish setup and force sellers to abandon their short term plans.

