-
Polkadot is currently trading at $6.34 with weekly losses topping 10%.
-
The interconnectivity blockchain is facing pressure from the ongoing crypto sell-off.
-
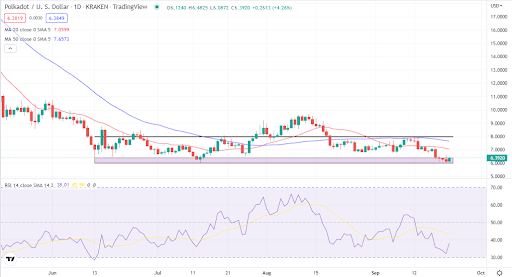
Technical charts show more weakness as the price retest support zone.
Polkadot DOT/USD has hit the floor, currently trading at $6.34. The price represents a 10.85% loss in the past week. DOT continues to suffer from the overall crypto bearish market sentiment. A hawkish Fed and BoE rate hikes are weighing down on the token just as the rest of the digital assets.
Equally important is the political instability rocking Eastern Europe. A possible escalation of the Russian-Ukraine conflict could be imminent. Russian President Putin has called for a partial mobilization to send more troops to Ukraine.
On the micro-level, Polkadot continues to unveil regular upgrades to enhance the blockchain. There is a stable performance on its parachains as well. Polkadot Insider report ranked Moonbeam’s GLMR token as the most traded on the network as of Sept.20. The parachain had $12.5 million in volumes. Its counterpart, MoonRiver’s MVR token, followed at $6.3 million.
In the past week alone, Polkadot has recorded more than $77 million in transfer volumes with a daily average of 1,200 new accounts.
More positive fundamentals relate to the platform’s new staking protocol. vDOT staking liquidity pool by Bifrost reported 121,551 minted tokens four days ago. Bifrost Finance is the top parachain on Polkadot and one of the major staking platforms.
DOT retests $6.3 support
 Source: TradingView
According to the daily chart above, DOT dropped from $8 to slightly above $6 in just ten days. The trend of lower highs and lower lows represents a 25% loss. Although the RSI shows some small buying, DOT faces potential consolidation at the 20-day and 50-day MA.
Concluding thoughts
The slide in DOT is not an ideal buying opportunity at the current level. The logic remains that the price is looking exceedingly bearish below key levels. DOT is also trading above the oversold zone at an RSI of 38. Above the benchmark, more downside could be seen before any trend reversal.

