Litecoin and Chainlink are bullish heading into the weekend, while Polkadot could lose its weekly gains if the bearish trend continues
Heading into the weekend, Litecoin remains bullish after rallying by 28% over the past week. It has established strong support at $271 and could surge towards $300 this weekend. Chainlink is also up by 26% over the past week but has lost steam in the last 24 hours. It is still primed to record gains this weekend despite slipping to the $40 level. Polkadot looks the gloomiest of the three after adding just 2.8% to its value all week. It is down by roughly 2% over the past 24 hours, and the weekend could wipe out its weekly gains if the trend continues.
LTC price outlook
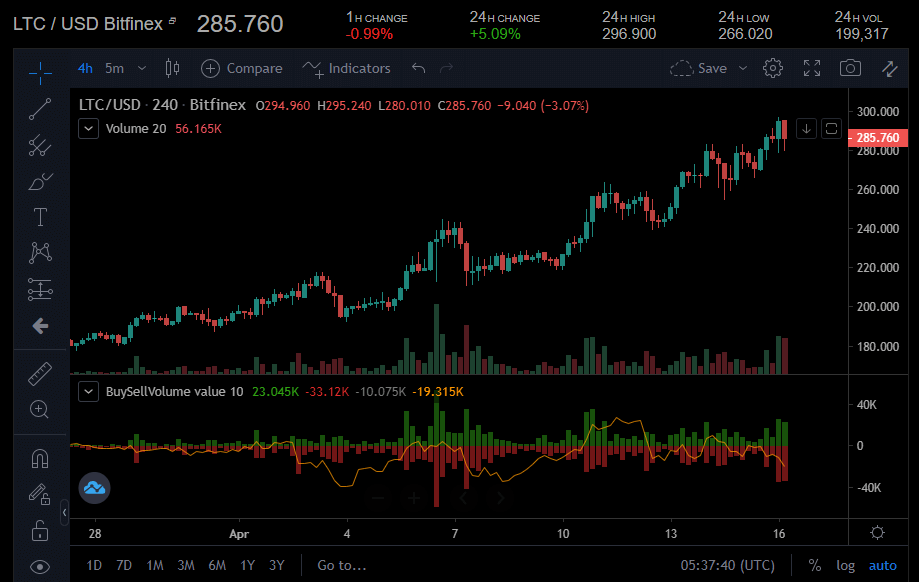
A look at the LTC/USD 4-hour chart shows Litecoin has established strong support at $271, which is comfortably above its 100-day simple moving average ($230.)
LTC will need to avoid a fall through to the $281 pivot level to allow it to take a run at the first significant resistance level at $296. However, it would need support from the broader market if it intends to break out from Thursday’s swing high at $291.25.

LTC/USD 4-hour chart. Source: Coinalyze
In the case of an extended rally this weekend, the next resistance level at $300 would likely cap any further moves to the upside. However, if LTC fails to avoid a fall through to the $281 pivot level, then the first significant support level at $271 will come into play.
LINK price outlook
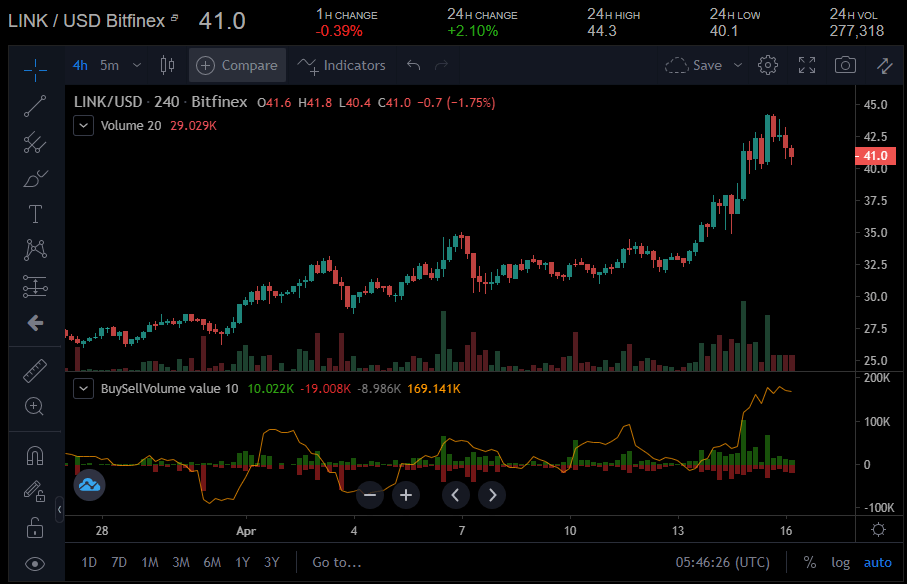
Chainlink is the other bullish coin heading into the weekend. It is up by 26% over the past week and could record further gains this weekend with the help of the broader market. From the LINK/USD 4-hour chart below, LINK has strong support at $39.70. If there is a rally this weekend, LINK could be looking to break past the first major resistance at $44.30.

LINK/USD 4-hour chart. Source: Coinalyze
An extended rally could see LINK surpass the $45 mark, setting a new all-time high in the process. However, any bearish trend from the broader market could drag LINK down, bringing the $35 pivot level into play. At the moment, LINK’s MACD and RSI indicators are bullish.
DOT price outlook
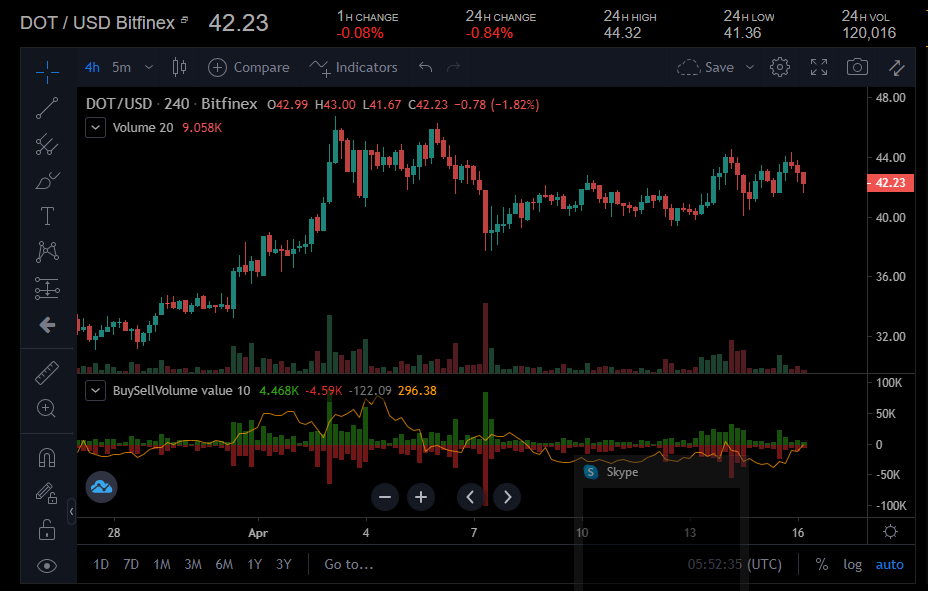
Polkadot is the most bearish of the three after going up by just 2% despite the rest of the market rallying. The DOT/USD 4-hour chart shows the cryptocurrency is slightly bullish, but bears are battling to gain control. If the current situation persists, DOT could slip below the $39.90 support, prompting further losses towards the $33 level.

DOT/USD 4-hour chart. Source: Coinalyze
However, if the buyers take control, DOT could make a run for the next resistance point at $46.15. An extended rally could see it set a new all-time high above the current one ($46.45). However, DOT’s technical indicators are mostly bearish at the moment, and it could sustain further losses this weekend.

