Litecoin is registering the biggest gains as crypto market turns bullish on PayPal adoption news
Litecoin (LTC) is trading higher on the day, jumping more than 14% in the past 24 hours. Litecoin’s upside momentum has gathered pace after an initial 11% spike came soon after the payments processing firm PayPal announced support for cryptocurrencies.
The cryptocurrency has broken above several hurdles, soaring from a low of $46 to touch highs near $56.50.
LTC price against the US dollar is currently around $55.50, up 5% on the day and over 18% in the previous session. Overall, Litecoin price is up 14% in the past 24 hours. LTC is also performing well against BTC, with the pair up more than 9% in the past 24 hours.
According to Asset Dash, a platform that tracks and ranks global assets by market cap, Litecoin’s $3.66-billion valuation has pushed it 71 places into 1306 globally. CoinMarketCap ranks LTC as the eighth largest cryptocurrency, behind ChainLink which has a market cap of $4.3 billion at the time of writing.
LTC/USD technical analysis
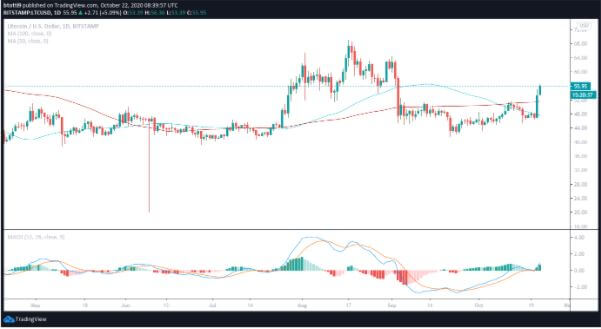
The daily chart has LTC/USD changing hands above the 50-day and 100-day simple moving averages. It is the first time the pair has traded above the moving average in over a month. If bulls hold these levels, the uptrend is likely to take it above $60.

The outlook on this time frame suggests that slight resistance is expected at $59.42. The area is close to the 78.6% Fib retracement level of the swing low from $62.87 high to $44.63 low. A breakout above this area highlights the next hurdle around $64.79.
The MACD level (12, 26) is flashing buy signals at 0.94, but the RSI is currently trending within the neutral zone. This suggests that while the bulls retain the advantage, the short term picture may involve a retrace to prices below $55.

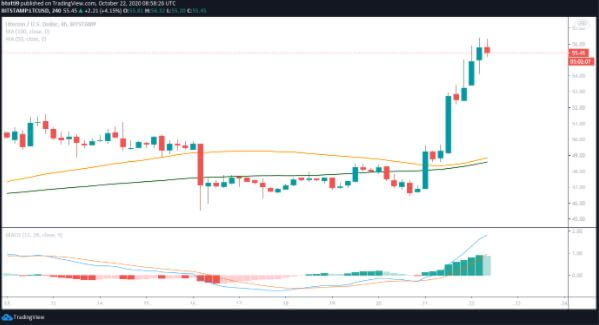
On the 4-hour chart, the RSI is trending up but not yet overextended. If it does, it’s likely to scuttle bulls’ plans, with prices dipping to accommodate an influx of selling pressure. However, the MACD is still bullish, indicating that any potential pullback for the LTC/USD might not be catastrophic to bulls’ plans.
If bears establish a foothold, healthy support around the SMA50 and SMA100 levels suggests that the bulls might still have enough power to withstand the downward pressure.

