

Litecoin mirrored a widespread sell-off in the crypto market after Elon Musk revealed that Tesla would not be accepting Bitcoin (BTC) payments
The price of Litecoin dropped to lows of $298 during the early trading session on 13 May, the dump happening as the market reacted to Tesla’s decision not to accept BTC for payments.
While the market is looking to buy the dip, thus rebounding off intraday lows, it remains to be seen how the Tesla narrative pans out. This comes after the company said it would be considering other cryptocurrencies.
“Tesla will not be selling any Bitcoin and we intend to use it for transactions as soon as mining transitions to more sustainable energy. We are also looking at other cryptocurrencies that use <1% of Bitcoin’s energy/transaction.”
Litecoin, which shed 17% to dip further off its recently reached new all-time high of $412, is trading above $330. Meanwhile, Bitcoin is looking to recover from a 15% dump to lows of $46k, with the benchmark cryptocurrency changing hands around $50,900.
Litecoin Price Analysis
A break below the support line of a contracting symmetrical triangle saw LTC price tank to lows of $298.
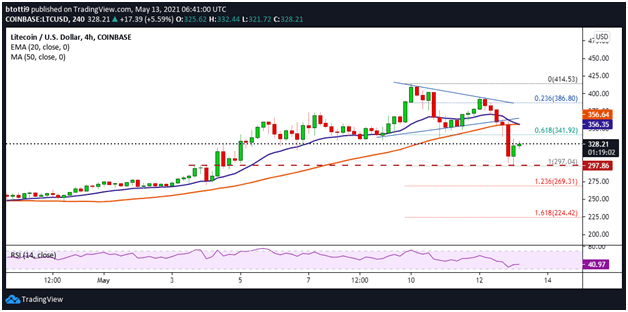
LTC/USD 4-hour chart. Source: TradingView
Litecoin bulls are currently looking to push prices higher after rebounding off the horizontal support line (red dotted).
As seen on the chart, buyers have managed to push prices above $300 and retested resistance at $335. There’s room for more gains, although the action is likely to be capped at the 61.8% Fibonacci retracement level ($341) and the 20-day EMA ($356).
If bulls push prices above the hurdles, the main short-term targets on the upside will be $384 and $400.
The LTC/USD 4-hour chart, however, shows that the RSI is below 50, indicative of bear presence despite the bounce off the oversold region. The downsloping curve of the moving average is also indicative of a potential flip lower.
Therefore, LTC/USD could break towards the $300-$270 region if the market trends downwards in the coming days.