-
Litecoin price has been in a strong bullish trend this week.
-
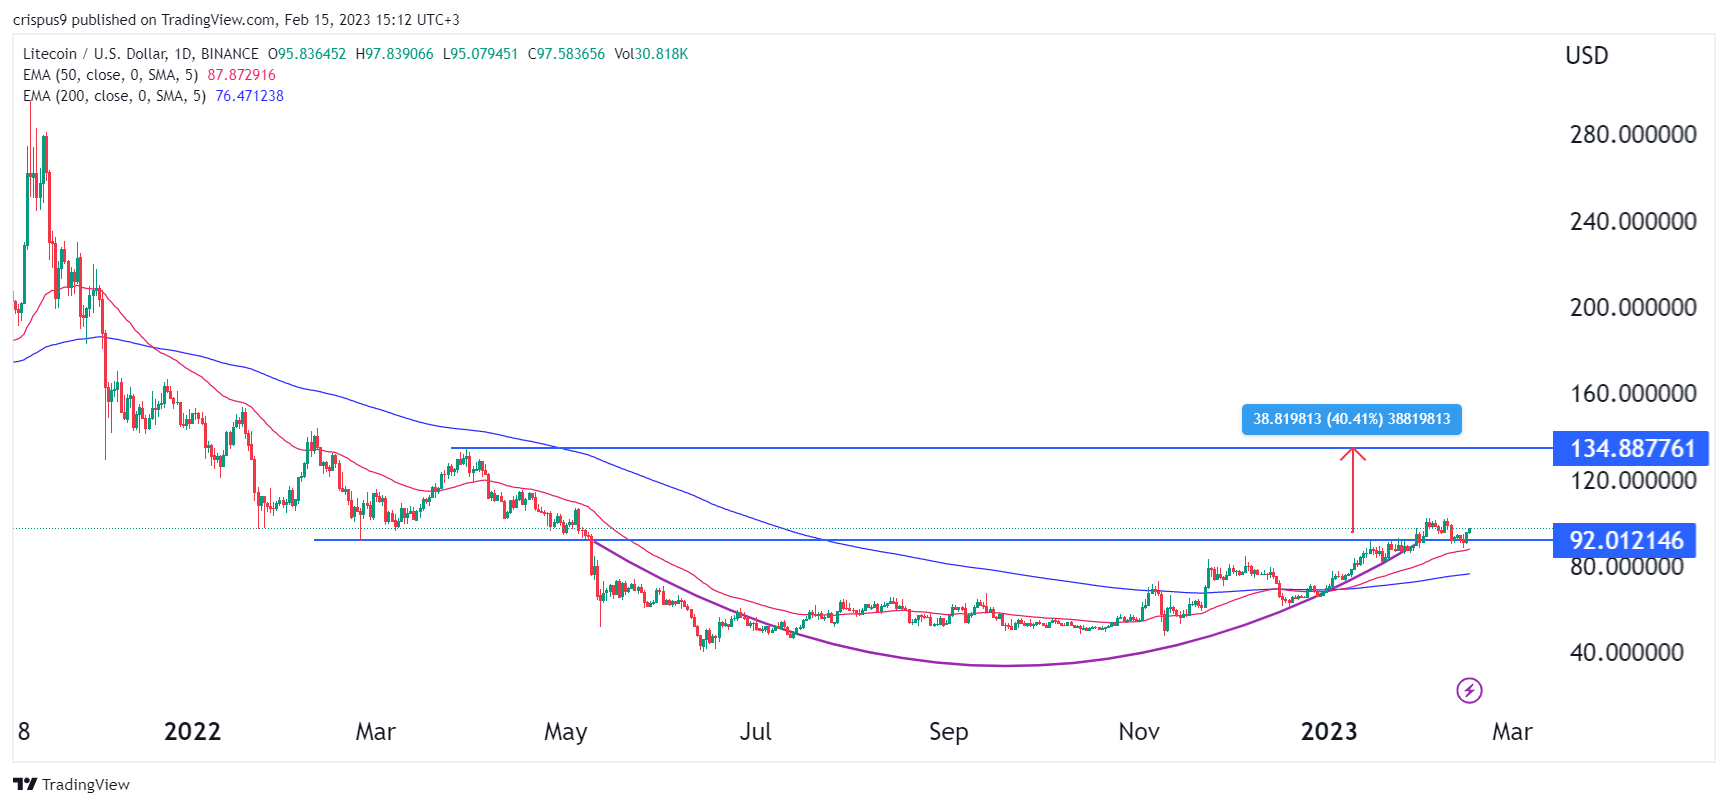
The daily chart analysis points to a 40% jump.
Litecoin price has made a strong comeback after the strong American consumer inflation data. LTC/USD jumped to a high of 97.56, the highest point since February 9. It has jumped by almost 10% from its lowest point this week and is closing in on the psychological point at $100.
Litecoin price prediction
Turning to the daily chart, we see that the LTC price has been in a strong bullish trend after crashing to a low of $44 in June last year. It has outperformed most cryptocurrencies, including Bitcoin, Ethereum, and Bitcoin Cash.
A close look at the chart shows that the coin has formed a rounded bottom pattern. This pattern has a close resemblance to a cup and handle and is a sign of a bullish continuation. It has also moved slightly above the 50-day and 200-day moving averages.
Notably, it has moved slightly above the important resistance level at $92, which is the highest side of the cup and handle pattern. It has also made a break and retest pattern. Oscillators like the Relative Strength Index (RSI) and the MACD have continued rising.
Therefore, Litecoin will likely continue rising as buyers target the key resistance point at $134. This is a notable level since it was the highest point on March 30th last year. It is also about 40% above the current level.

LTC price forecast (4H chart)
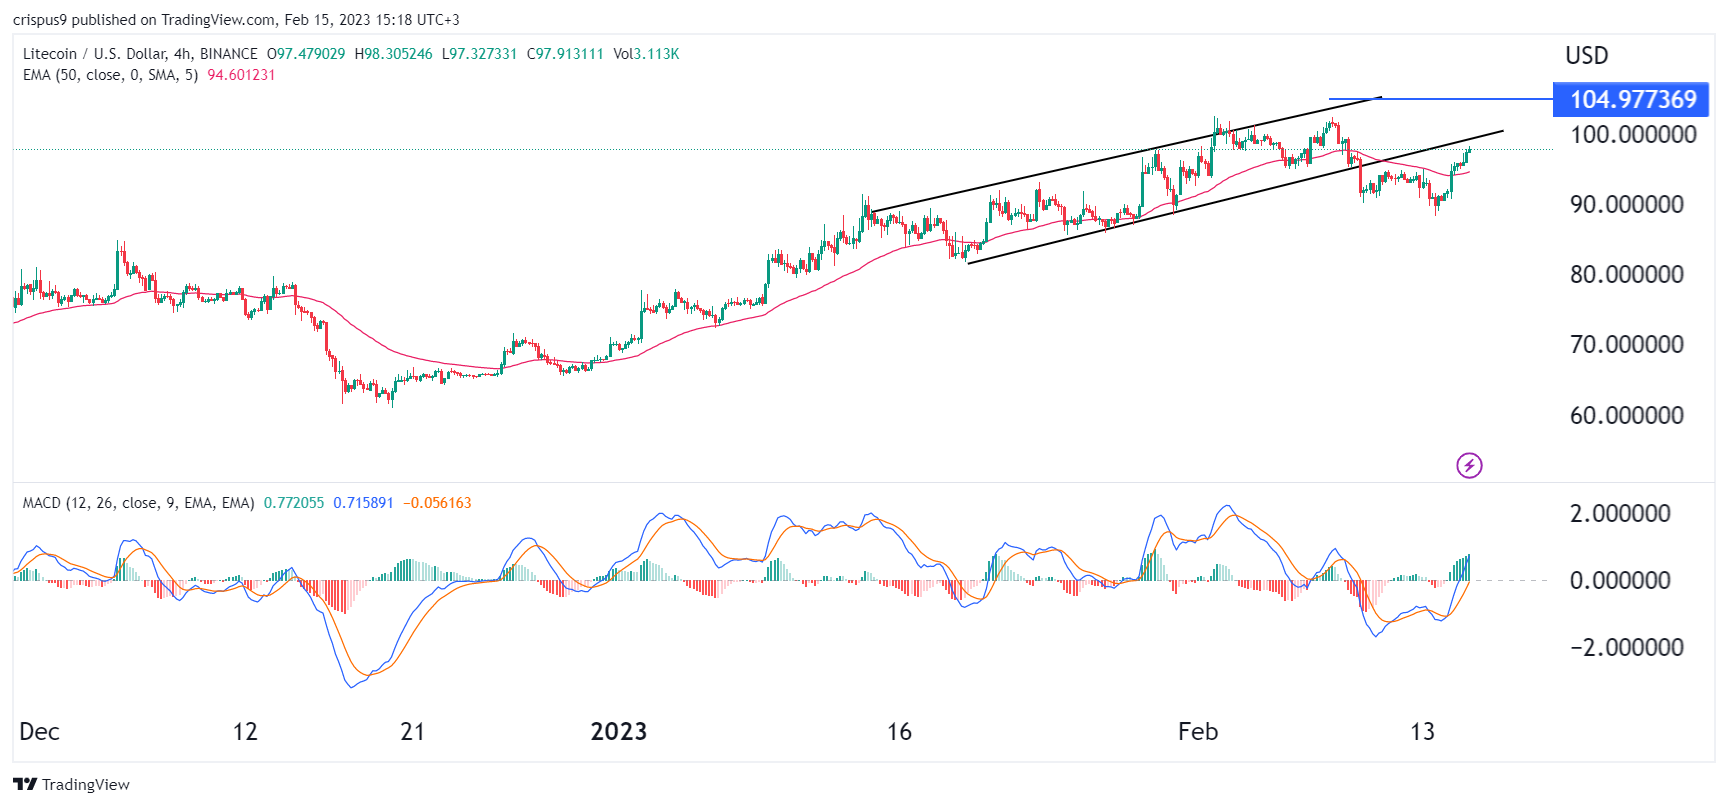
On the 4H chart, we see that the LTC crypto price has bounced back after it collapsed to a low of $88.40. It is approaching the lower side of the ascending channel that is shown in black. The coin has moved above the 50-period moving average while the histogram of the MACD has moved above the neutral point.
Therefore, Litecoin price will likely continue rising as buyers target the key level at $100. A move above that level will signal that there are still more buyers left in the market. If this happens, the next key level to watch will be at $105, the upper side of the channel.
However, this rebound could be a break-and-retest pattern. If this is the case, the coin will likely resume the bearish trend in the coming days. Therefore, buyers need to initially move above the lower side of the channel.


