LTC/USD rose to $195 before sellers pushed it to $180
Litecoin is among several altcoins that have shone as Bitcoin has retreated from its recent all-time high. The cryptocurrency mirrored other big gainers such as Binance Coin, Cardano, and ChainLink in moving higher.
LTC price moved to highs of $195 on Wednesday before correcting the gains amid a lull in the broader market. The move represented Litecoin’s highest price level in nearly three years. The last time LTC/USD exchanged hands at the $195 level was in March 2018.
Litecoin price spiked amid network growth
At the time of writing, LTC trades at $186. It is about 3 % lower on its 24-hour opening price, but still more than 22% up over the past seven days.
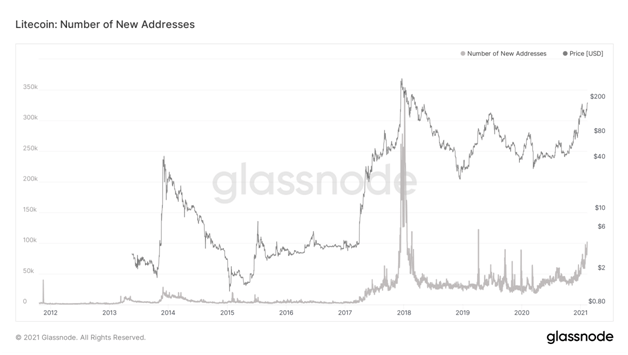
This uptick in Litecoin’s price coincides with a spike in network activity, according to data shared by on-chain analytics platform Glassnode. As per the firm, active addresses have jumped to 231,973, a new high that represents the biggest growth since 5 June 2020.
There has also been a spike in new addresses, with this rising to 101,862 for its highest count since April 2019. The increase in new addresses is a key metric that suggests more investors have joined the network and are adding to the buy-side momentum.

Litecoin chart showing increase in new addresses. Source: Glassnode
Litecoin price outlook
LTC/USD
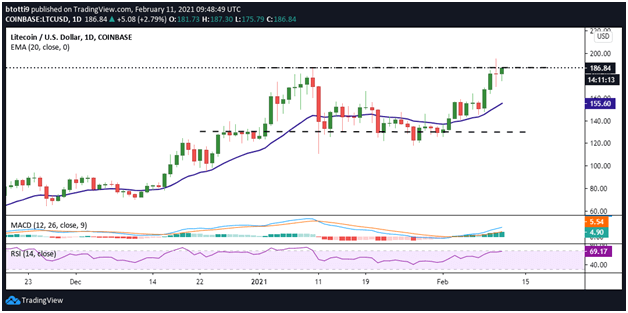
Litecoin (LTC) failed to sustain the momentum after touching the multi-year high of $195, as the previous candlestick shows. Aggression on the part of the bears appears to have fizzled out, with bulls seemingly energised after buying the dip.
Currently, extending gains above the resistance level at $186 is the main goal for bulls. That would allow them to retest 10 February intraday highs. If sellers’ stubbornness breaks, upward action will likely shoot LTC/USD past $200 and see it settle above $220.

LTC/USD daily chart. Source: TradingView
The MACD and RSI indicators give bulls the upper hand and prices above $250 offer a legitimate short term target.
Bears are, however, likely to stage another vigorous sell-off if prices reach the above levels.
If bulls fail to keep LTC/USD above $185, increased profit booking could accelerate a retreat towards the 20-day exponential moving average. The EMA offers a buffer zone at $155.
Failure to consolidate above the price level could leave a horizontal support line at $130 as the main anchor. A breakdown beyond this support line could tip LTC/USD towards $100.
