Litecoin jumps 13% to $83.97 but faces stiff resistance at the YTD high of $84.34
Litecoin’s price jumped to a high of $83.97, with a bullish breakout seen over the past week sending the altcoin to its highest price level since February 2020.
LTC, now ranked 6th among the largest cryptocurrencies by market cap, is about 13% higher on the day and 32% over the week. However, while bulls could still hit a new year-to-date (YTD) high, the technical outlook for LTC/USD suggests bears are preparing for downward action.
At the time of writing, LTC/USD deals are priced at around $81.67, with the coin’s upside momentum slowing and inches away from the $84.34 high reached on 13 February. If this short term correction gathers momentum, it risks scuttling bulls’ plans for a breakout to $90.00 and then the psychological $100.
LTC/USD price analysis
LTC is one of the biggest gainers among the top ten cryptocurrencies in the past 24 hours.
But the scenario could easily turn bearish for Litecoin price if bears rally to confirm a downside flip suggested by the TD sequential indicator.
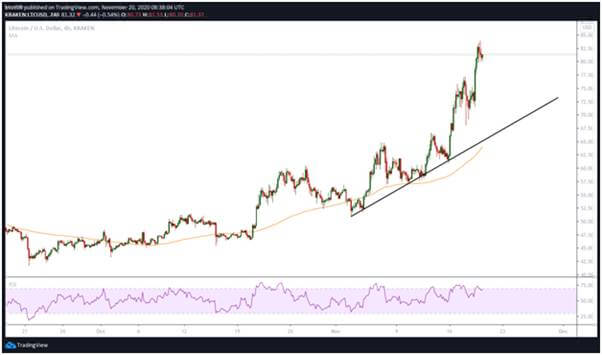
The 4-hour chart shows eight green candlesticks, which suggests that the bullish momentum seen over the past several days is at risk of weakening. The LTC/USD pair could thus reverse if the sell signal is confirmed within the next few hours.

Litecoin price 4-hour chart. Source: TradingView
The negative forecast has further support from IntoTheBlock’s In/Out of the Money Around Price (IOMAP) summary chart. As per the data, the $84.00 area presents a solid resistance block and could be responsible for a downturn to the support area at $80.00.

Bulls face a battle at $84.00 as shown on the IOMAP chart. Source: IntotheBlock
A breakdown at the above price level will increase the bearish pressure and likely dump LTC/USD to lows of $76.00 (previous high on 17 November). The 200-SMA ($64.01) provides further support if bears strengthen their grip.

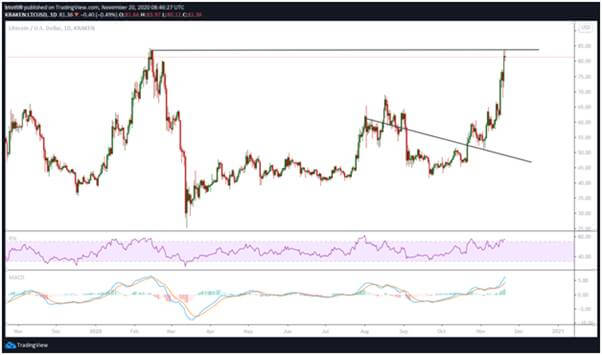
LTC/USD price daily chart. Source: TradingView
On the other hand, Litecoin price needs to stay above the 10-EMA and 50-SMA (daily chart) to leave the bullish setup intact. This picture is helped by the RSI and the MACD indicators, which suggests that bulls have the advantage going into the weekend.
If they hold prices above $80.00 and successfully take out the $84.00 barrier, the upside momentum could push LTC price to $86.00. Above this level, the IOMAP suggests the next hurdle is at $90.00 and then at $100.

