NEM (XEM) managed to gain 20% on the day after bouncing from its long-term triangle formation, before starting a retracement. What’s next in the store for NEM?
Although NEM (XEM) is continuing to consolidate at the bottom of its long-term triangle formation, a hint of bullishness came to the cryptocurrency as it (at one point) managed to jump up in price by 20%. While the move has died down since, some of the value gained has been preserved.
NEM’s overall outlook is extremely bullish due to its booming fundamentals. NEM announced on its Twitter that Nikkei Sangyo Kokokusha, part of the Nikkei Group, will start working with NEM in Japan to build NEM’s brand and support the launch of Symbol.
NEM managed to gain only 0.16% week-over-week. However, that price performance still exceeds BTC’s 11.25% loss and ETH’s 5.83% loss. At the time of writing, XEM is trading for $0.2386, which represents a price decrease of 7.12% when compared to the previous month’s value.
XEM/USD
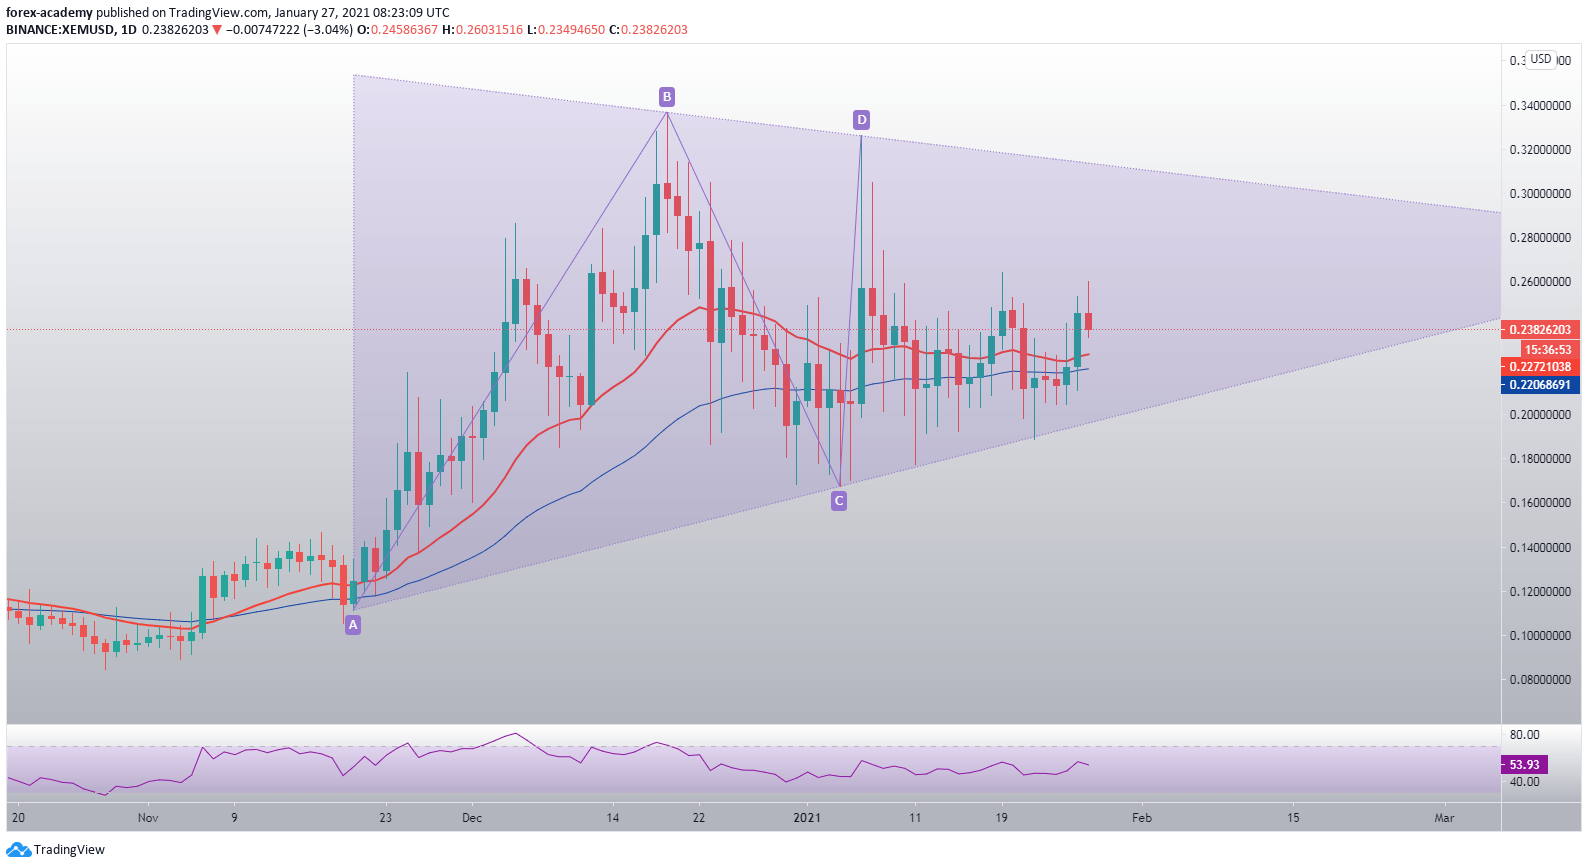
XEM is currently trading within the long-term triangle formation it started forming in late December 2020. Its price is following the bottom triangle line, bouncing off of it and moving to the zone around $0.26 each time.
While XEM is far away from resolving the triangle formation, the formation’s bottom line is currently its strongest (and closest) support level. On the other hand, its upside is guarded by many resistance levels, with its immediate resistance sitting at the $0.2595 level.

XEM/USD daily price chart. Source: TradingView
XEM’s RSI on the daily time-frame is currently ascending, with its price sitting at the value of 50.73.

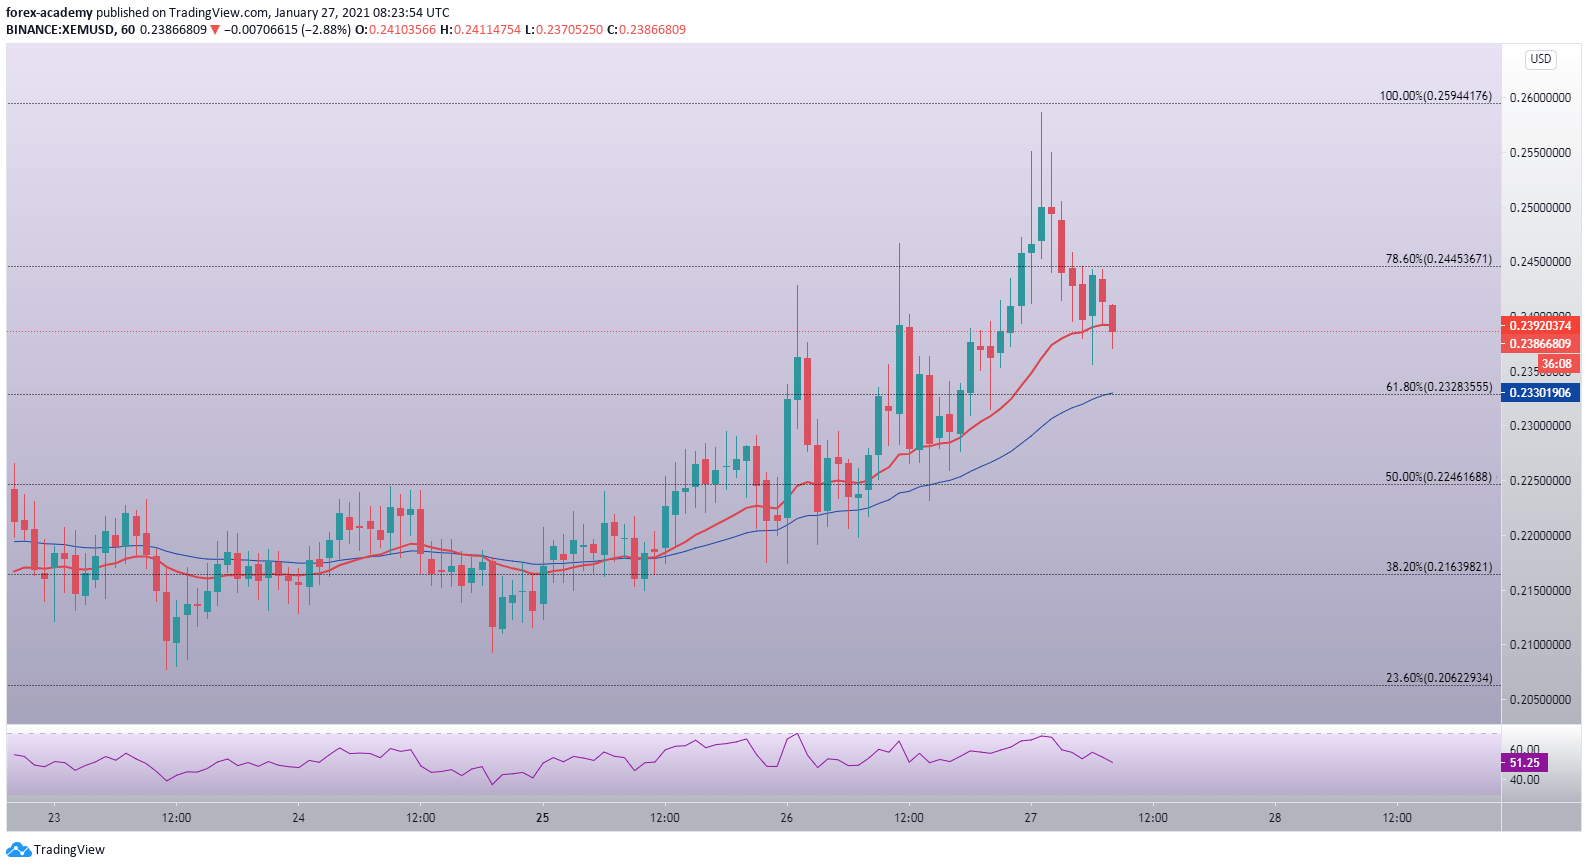
XEM/USD 1-hour chart. Source: TradingView
XEM’s hourly timeframe shows us how the cryptocurrency pushed towards the upside in a swift and explosive manner, overextending and crashing back each time. Its latest peak is the $0.2577 level. After not being able to break the $0.2595 Fib retracement, XEM pulled back below the 78.6% Fib retracement and the 21-hour EMA.
Its current short-term support levels are the 50-hour EMA and the 61.8% Fib retracement of $0.2328.

