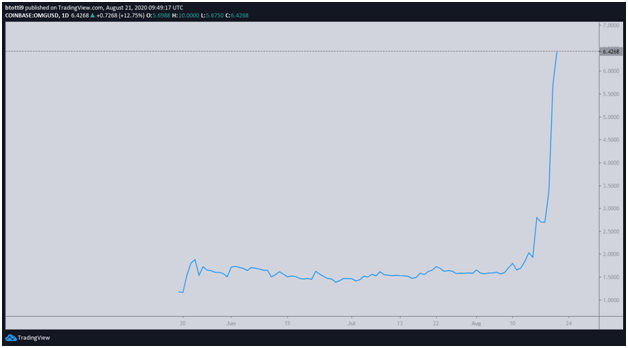
OMG’s chart is almost vertical after skyrocketing nearly 100% following its integration with leading stablecoin Tether
Traders are likely to have said, “OMG!” after the price of OMG Network’s token skyrocketed by nearly 100% in just 24 hours. After struggling under $2.00 just last week, the token’s price mooned to $10.00 within hours, before rebounding down to $6.40 as of writing.

Why did OMG skyrocket?
On August 20, Tether announced that USDT was now live on the OMG Network.
Soon after, the price of OMG against the USD shot through the roof with a 68% surge — from a low of $3.35 to $5.56 within minutes. The remarkable rally in the past 24 hours even saw the Ethereum-based token jump to highs of $10.00 on Coinbase, the highest price for the cryptocurrency since June 2018.
OMG is the native ERC-20 token on the OMG Network, (initially called OmiseGO) and traded at a low of $0.50 after prices crashed during the mid-March 2020 bloodbath. Attempts to cross the $1.00 price level failed multiple times before Coinbase listed the token to spark a rally to take it above $2.00.
The network provides a layer 2 scaling solution that allows for cheaper value transfer on the Ethereum. Its integration with Tether’s USDT has added to its importance, especially as decentralized finance protocols have seen spikes in user activity, leading to congestion and higher fees on the Ethereum network.
The USDT is the next most traded cryptocurrency after Bitcoin. What this means is that integration with OMG adds to the latter’s potential to help reduce network congestion on Ethereum. The benefit would be the increased use of the OMG network, likely fueling its uptake as it presented itself as a cheaper option.
OMG price outlook
OMG traded around $2.00, but is now more than 220% up, with prices likely to stay around $5.00-$6.50 short term. But after teasing $10.00, bulls have the room to attempt another assault.
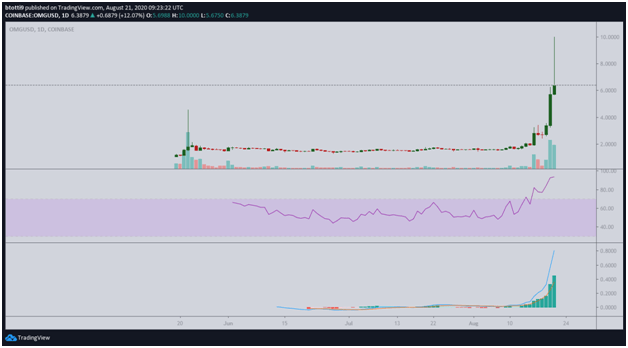
However, a look at the daily chart suggests the OMG price could record a strong reversal if bulls don’t find major support zones between $4.00 and $6.50.

As the chart shows, OMG/USD is trending firmly fixed in the overbought zone. The RSI is currently at 93; deep into overbought territory. The MACD maintains a similar bullish trend to suggest a dip is likely if selling pressure appears.

