Bitcoin (BTC) investor suggests BTC above $14,000 opens a clear path to $20,000
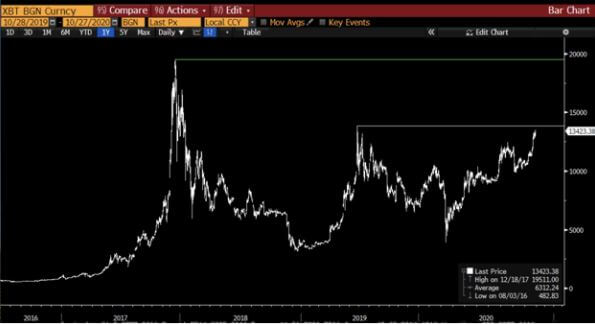
Bitcoin’s steady grind up the charts has seen it hit a high of $13,864, a level just shy of its 2019 highs around $13,880. The market is largely bullish on BTC hitting a fresh weekly close high, with the monthly close also seen as likely to cement the upside momentum.
BTC on verge of a major breakout
Bitcoin price is on the verge of a major bull run after posting a pivotal breakout that is likely to see it mirror the action prior to the last bull market when prices romped to a high of $20,000.
From a technical perspective, BTC/USD has broken above several resistance levels over the past few weeks.
Currently, the price is flirting with the 23.6% Fibonacci retracement level on the upswing from lows of $13,062 to highs of $13,864. The hurdle is sandwiched between the major support level near the weekly low of $12,776 and the monthly high.
The target of $14,000 lies near the 38.2% Fib retracement level, with the next major resistance area at the 61.8% Fib retracement level on the weekly timeframe. Above this, bulls will seek to close $15,000.
According to one analyst, “the sky is the limit now […] and this market is not for shorting”!
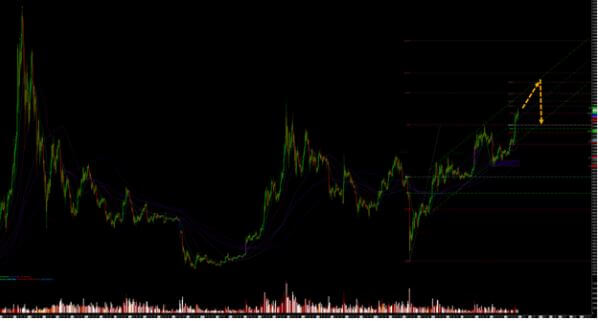
The trader shared the chart below, noting that Bitcoin is currently trading above “all downtrends from the 2017 20k top”. Also crucially, the technical outlook over the past few weeks has the price above the major resistance area at $12,000.

As per Raoul Pal, the CEO of Global Macro Investor, $20k is the next target once BTC/USD closes above $14k.
He noted in a series of tweets that said BTC is unstoppable at the moment.
“There are literally only two resistances left on the Bitcoin chart -$14,000 and then the old all-time high at $20,000. I fully expect new all – time highs by early next year at the latest.”

While Bitcoin appears set for a relentless march, the near term picture suggests that traders need to be cautious. The Stochastic RSI is suggesting that the asset is trending in the overbought zone and historical patterns point to the potential for several pullbacks along the way.
This is the view of one crypto analyst, who suggests Bitcoin’s updraft will shortly take its price past the $14,000 resistance level — largely unhindered. But he believes the rally to highs of $15,000 will hit a sharp sell – off and potentially flip to lows of $12,000.

Also important will be how Bitcoin trades ahead of Friday when a massive 62K options expire. At the time of writing, Bitcoin is changing hands around $13,775, still up by more than 4.7% in the past 24 hours.

