Polkadot got one step closer to reaching its all-time highs as DOT price passed $25
Fundamentals and past price performance
Polkadot entered a major uptrend on 28 December, where it has remained until today. The cryptocurrency managed to rise from $5 lows to highs of above $25 in recent days. This was all made possible by DOT’s fundamentals, which are more than strong.
DOT managed to post week-over-week gains of 17.64%. When compared to other cryptocurrencies, BTC gained 17.63%, while ETH managed to gain 3.89% over the same period.
At the time of writing, DOT is trading for $25, which represents a price increase of 57.57% when compared to the previous month’s value. Polkadot is currently the 6th-largest cryptocurrency by market cap, boasting a value of $22.87 billion.
DOT/USD daily chart price analysis
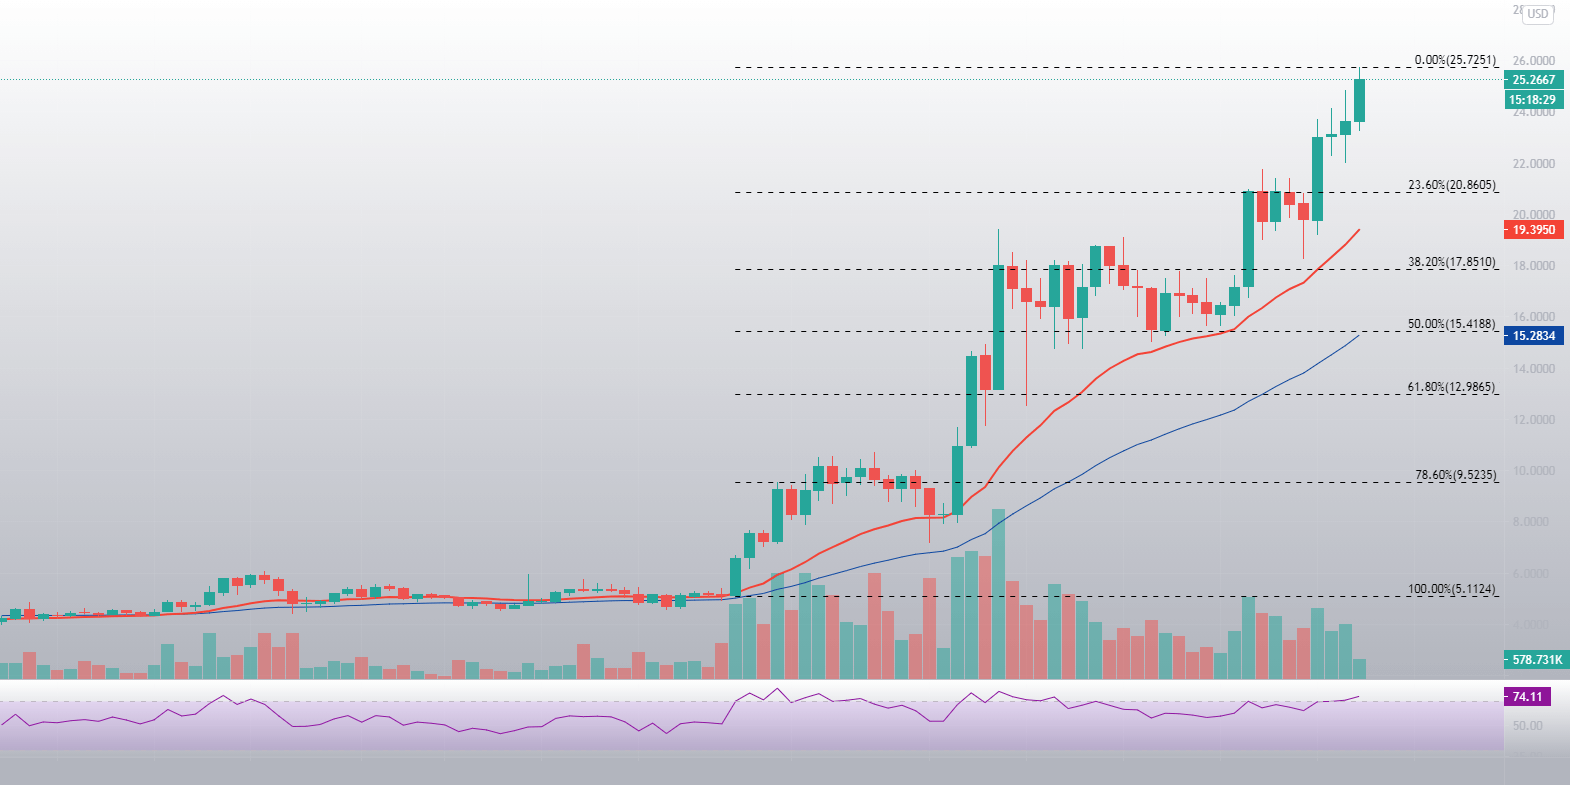
Polkadot (DOT) has seemingly reached its top after not being able to push past the area around $20.85. However, a recent surge in buying power sparked by fundamentals pushed the price up towards (and past) $25. While it is uncertain on what Polkadot will do now in terms of price direction, one thing is certain: such strong fundamentals will certainly bring its price above its all-time high of $50.70 at some point.
DOT faces a strong resistance zone at the $25 mark, while its first strong support level is at $20.85.

DOT/USD daily price chart. Source: TradingView
DOT’s RSI on the daily timeframe has entered the overbought zone, with its current value sitting at 74.11.
DOT/USD hourly chart price analysis
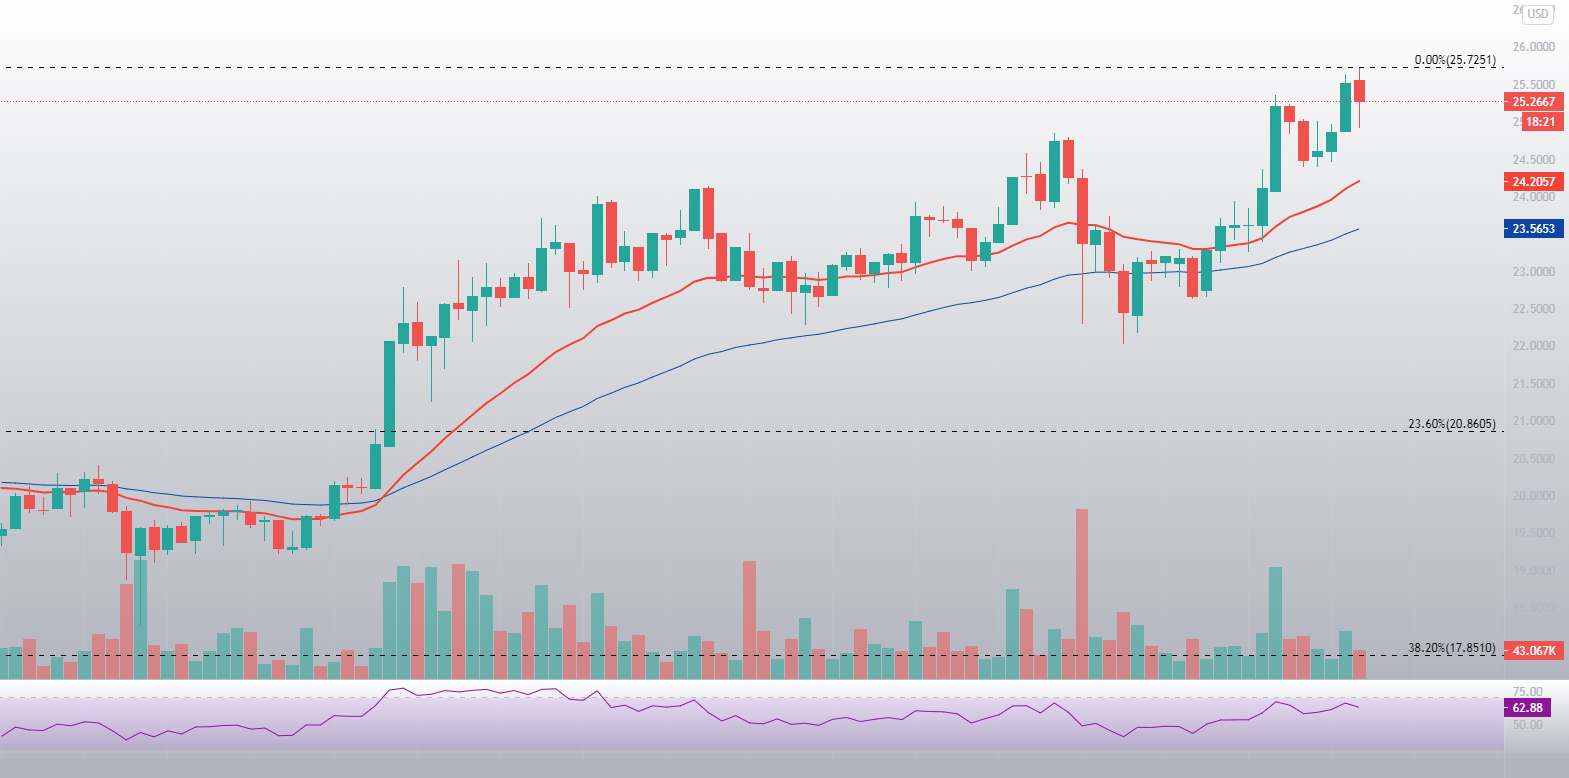
The hourly time frame shows us a lack of significance for the 21-hour and 50-hour EMAs. This means that traders shouldn’t count on these lines acting as strong support or resistance levels.

DOT/USD 1-hour chart. Source: TradingView
DOT’s volume is still on extremely high levels, indicating that the cryptocurrency is fighting to get past the $25 level.

