-
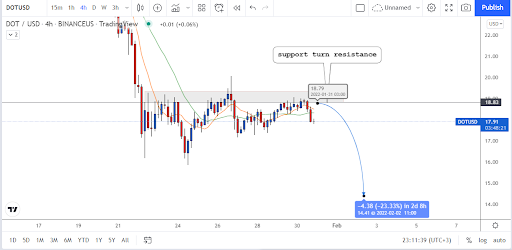
Polkadot prices rose early in the trading day, breaking over the $18.51 barrier level.
-
Price movement was optimistic, hitting as high as $18.88, despite a 20% drop in trading volume.
-
Current trends indicate that selling pressure will increase as volatility rises.
After almost seven weeks of oscillation, the 21 January sell-off caused DOT to relinquish its oscillating pattern of $29.9-$23.11. Ever since, the bears have gained control, converting the $23.11 five-month support level into resistance.
The cryptocurrency plummeted to a 25-week low on January 24, posting a 38.34 percent drop. DOT created an ascending triangle on its 4-hour chart during the last several days as the bulls strengthened their pressure.
 Source – TradingView
Polkadot price research indicates that the coin is on the rise. On the day's session, the price jumped 4 percent to $18.88. In doing so, DOT broke over the $18.51 resistance level, which is currently at $20.44. Furthermore, trading volume for DOT declined by more than 20%, presenting a perfectly positive picture throughout the day's trade.
Recent price movement suggests that most traders are ready to cash out, which will increase market volatility.
From January 17, the DOT value has been associated with a sinking cryptocurrency market, but it has just seen its first daily uptick since then. Traders are anticipated to be wary of the present volatility, which will aid in pushing prices down in the next session.
DOT has formed an ascending triangle
The cryptocurrency plummeted to a 25-week low on January 24, posting a 38.34 percent drop. DOT created an ascending triangle on its 4-hour chart during the last several days as the bulls strengthened their pressure.
While in line with the price, the initial support was mainly near the 50-point level. Furthermore, the CMF (Chainlink Money Flow) recovered above the midpoint and demonstrated a positive bias. Nevertheless, the OBV was unable to overcome its first resistance.
