BCH and VET have gained double-digits while ADA bulls are eyeing a break above a major barrier
Bitcoin Cash (BCH), Cardano (ADA) and VeChain (VET) are all facing major overhead resistances as bulls bid to reach new highs.
As of writing, all these coins are trading in the green though. The upsides follow in the footsteps of Bitcoin (BTC) that has climbed back above $37,000 and Ethereum (ETH), which has broken above a major resistance line and is likely set to see a new all-time high.
Here is the short term outlook for BCH, ADA and VET:
BCH/USD
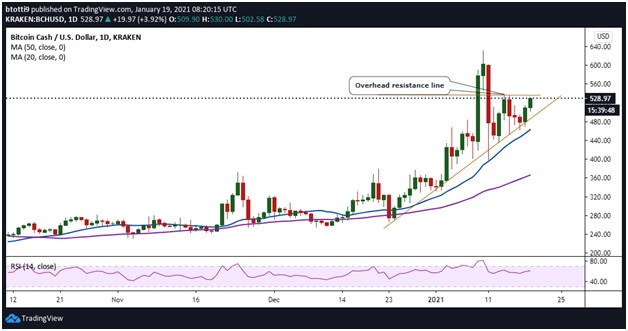
Bitcoin Cash has run into overhead resistance after surging from lows of $479 to reach highs of $530. Although significantly lower as compared to the current year’s highs of $630, the uptrend could see bulls target the zone with a breakout.
The encouraging sign for BCH bulls is that the market aggressively bought the last dip. If buyers can thus push prices above $530 and sustain pressure near $580, the next move could involve the reload zone near $630.

BCH/USD daily chart. Source: TradingView
The RSI maintains a positive divergence as it looks to turn into the overbought territory. Meanwhile, the 20-SMA and 50-SMA curves are also upsloping to suggest a bullish bias.
If bulls manage to reach $630, the next major target will be $800.
On the downside, rejection below the trendline could see BCH/USD decline to the 20-SMA ($462) and then 50-SMA ($366).
ADA/USD
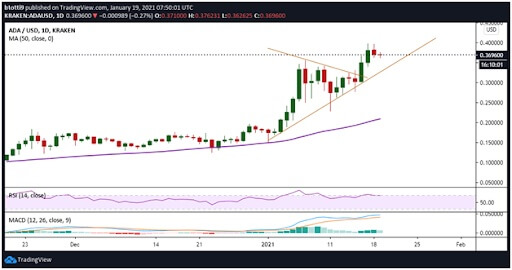
Cardano has retreated slightly and currently trades around $0.36 on most major exchanges. There’s a suggestion of a bearish Doji on the 1-day chart, which could suggest further losses. However, the ADA/USD pair remains above a short term downtrend line. As long as price doesn’t dip below the rising trendline support line, bulls will remain in control.
In this case, prices could retest the overhead resistance line at $0.40, with a clear break opening up an upside to $0.45 and $0.50.

ADA/USD daily chart. Source: TradingView
The daily RSI is near the overbought zone and a MACD in the bullish zone also supports the short term positive outlook.
On the contrary, a break below the trendline could see sellers target prices below $0.30 and the 50-SMA ($0.20).
VET/USD
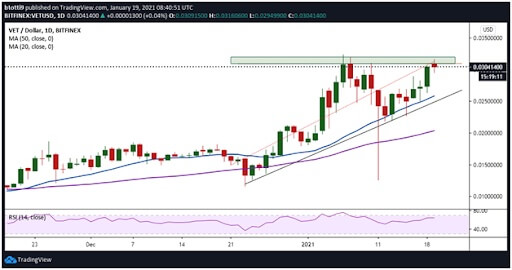
Bears are aggressively defending gains below a key price level also eyed by the bulls. With its price currently around $0.030, VET/USD is within reach of the critical resistance line of $0.031.
Despite bears’ attention, bulls look focused on breaking above the horizontal trendline of an ascending triangle pattern recently formed on the daily chart.

VET/USD daily chart. Source: TradingView
If buy-side action pushes VET past the $0.031 barrier, bulls can extend their upside advantage to $0.040. From here, buyers can target $0.043 and then $0.050.
On the downside, short positions around the 20-SMA ($0.025) and 50-SMA ($0.020) will interest bears.

