

The technical outlook for LINK/USD, XLM/USD and DASH/USD suggests bears could eye fresh moves
ChainLink, Stellar and Dash are all struggling to stay above a key support level, with fresh declines looking likely to come hot on the heels of massive losses earlier in the week. The negative outlook is likely to strengthen if Bitcoin dips towards weekly lows again. Ethereum has recoiled more than 5% in the past 24 hours, while Binance Coin has dropped 11% and Polkadot has declined by 10%.
Here’s how the rest of the cryptocurrency market looks this Thursday as we head into the European and US trading sessions.
ChainLink price
LINK/USD plunged to lows of $12 before aggressive buying pushed the price above $30. However, bears were not done, with Link prices falling to lows of $20 again, bulls have also purchased the dip causing prices to currently fluctuate at levels above $27.
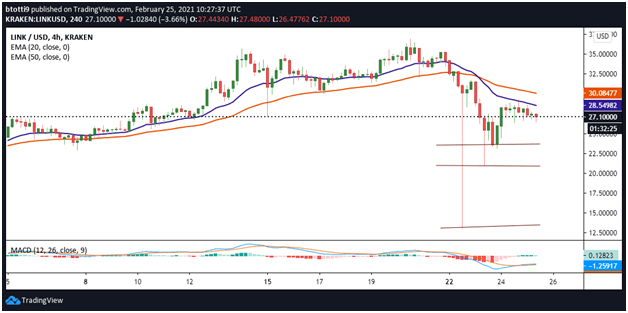
However, the upside has stalled for now, with bears refusing to give up positions at the 20-day EMA ($28.50). If bulls recapture and flip the level into support, the next target will be the EMA50 at $30 and then to recent highs around $35.
On the contrary, a downward flip could see bears target $23 and the aforementioned weekly lows of $20 and $12.
Stellar price
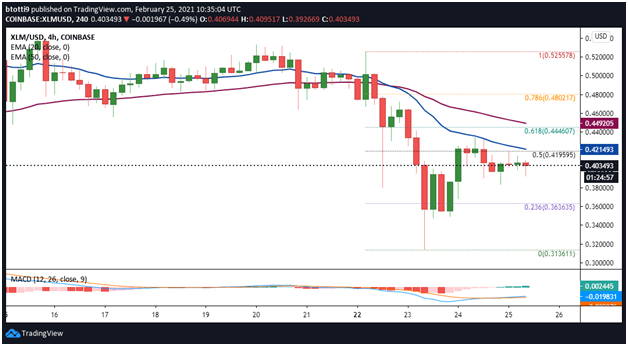
Like other altcoins, Stellar (XLM) saw its price plunge to lows of $0.31 before bulls also bought the dip and pushed it back above $0.40.
Currently, buyers are struggling to break above the 0.5 Fib level ($0.41), above which XLM/USD could retest the EMA20 level ($0.42). The next hurdle is at $0.44, where we have the EMA50 and the 0.618 Fib level of the swing from $0.52 high to $0.31 low.
The MACD suggests a hidden bullish divergence, which suggests increased buy-side pressure could push XLM to $0.50. Another leg up could see buyers looking at prices near $0.60.
On the downside, plummeting below $0.40 could take XLM/USD to initial support at $0.38. If the market witnesses increased selling pressure, the next stop could be at $0.36, with more losses likely if the price touches lows of $0.30.
Dash price
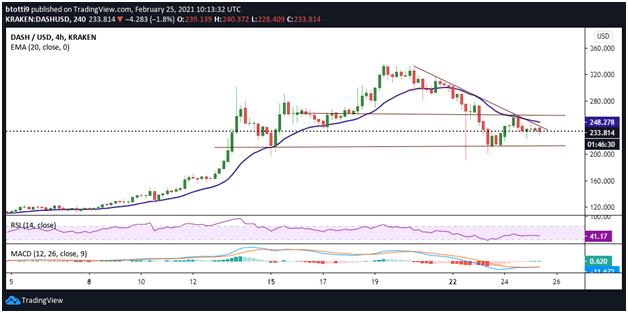
The 4-hour chart highlights that Dash bulls have found it difficult to flip resistance at $248 (EMA20) into support. A spike above this zone could see bulls target resistance at $260 and then $280.
The RSI, however, remains below the middle point, while the MACD is within the bearish zone to suggest bears still have control. The appearance of a declining trend line also indicates waning bullish momentum. If this pattern continues, it could spell danger and invite an extended decline.
If DASH/USD drops below $230, it could decline to $214 and then psychological support level at $200.