XRP, IOTA, and Stellar are all primed for further gains as we head into the weekend
As the weekend approaches, Bitcoin is looking to establish itself above $48k, which could see bulls target the 50K level. Ethereum could also hit a new high above $1,800, while the prices of Binance Coin, Cardano, and Polkadot could also spike heavily amid an overall bullish sentiment.
But three other coins to watch this weekend are XRP, IOTA and Stellar’s XLM.
XRP price
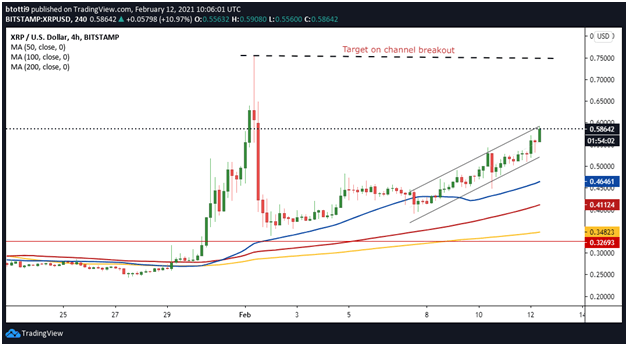
Ripple’s XRP has stayed within the top 5 of the largest cryptocurrencies despite the negative impact of last December’s SEC lawsuit. After its price pumped to $0.75 and swiftly dipped to $0.35, XRP has ticked up 22% over the week to break above $0.55
Currently, XRP/USD is trading at $0.58 and has printed higher highs and higher lows within an ascending parallel channel on the 4-hour chart. A breakout above the channel could see prices rally to early February highs of $0.75 and YTD peak near $0.80.
However, if bears take control, increased sell-side pressure could push prices to lows of $0.50. A bearish flip extended to the next week could put the uptrend in jeopardy and invite pressure towards the 50-SMA ($0.46) 100-SMA ($0.41) and 200-SMA ($0.34) support levels on the 4-hour chart.

XRP/USD 4-hour chart. Source: TradingView.
IOTA price
IOTA has surged about 150% this week, with a cool off seeing trim gains over the past few hours. But after tapping into the Oracles market that drives the DeFi space, sentiment is high on IOTA price.
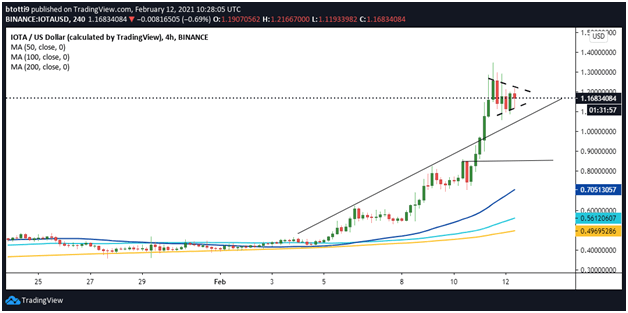
IOTA/USD reached a local high of $1.4 on 11 February after spiking from lows of $0.72. The action over the past few sessions on the 4-hour chart suggests that peak might have formed a local top too.
IOTA is however likely to break higher given the potential for a bull flag pattern. If bulls keep prices above $1.13 as seen on the chart, a breakout on the upside could see it retest resistance at $1.4. Such a scenario would see an influx of buy orders, with prices likely to retest $1.60-$2.0 this coming week.
On the downside, IOTA/USD could dip to initial support at $1.07 and then a horizontal line at $0.84. Further declines could force bulls to defend gains at the 50-SMA ($0.70), 100-SMA ($0.56) and 200-SMA ($0.49).

IOTA/USD 4-hour chart. Source: TradingView.
Stellar price
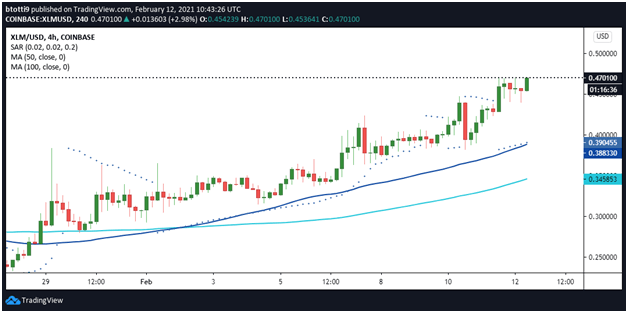
Stellar (XLM) has been trading higher over the week, hitting a new 52-week high of $0.47.
Although XLM/USD has slipped to $0.45, bulls remain in control and could eye prices above $0.65 short term. A steady run above this resistance level could see XLM price swing towards the $0.93 all-time peak reached in January 2018.
As well as the positive picture signaled by the RSI and the MACD, XLM price is above the parabolic SAR points. A golden cross of the 20 and 50 SMAs also suggest a continuation of the uptrend.
If bulls hold above $0.45, cracking the next hurdles at $0.55 and then $0.65 could allow for increased buying. Short term, the target would be the all-time high and the psychological $1.00.

XLM/USD 4-hour chart. Source: TradingView.
On the downside, a dip below $0.45 would open up potential declines to the 50-SMA ($0.38) and 100-SMA ($0.34). Below these support levels, bears could eye $0.30.

