QTUM/USD reached a new local high of $5.40 before retracing to around $4.55
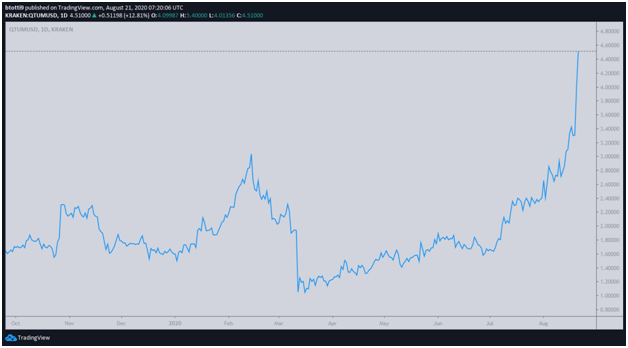
Qtum is up nearly 30% in the past 24 hours, with a major rally during the Asian trading session taking its price to a new year-to-date high of $5.40.
Although the token has since seen a slight retreat and was trading around $4.55 as of th time of writing, bulls look likely to retest the area.

The Qtum blockchain and its native token are seeing increased attention after Founder Patrick Dai announced a $5 million fund for attracting developers in the decentralized finance (DeFi) ecosystem.
Qtum hopes to convince DeFi developers and users that its low fees and higher transaction throughput make it a better alternative to Ethereum, which has had network fees hitting all-time highs due to mempool congestion.
Since the announcement on August 17, the price of QTUM/USD has literally shot up. After rallying more than 10% on the day, Qtum has continued to trend with a bullish bias over the past week.
The 37th ranked altcoin is now more than 60% up over the week, with more upsides to potentially come given the high levels of optimism as Qtum approaches its upgrade, scheduled for August 28. The introduction of the proposed cold staking could be another bullish sign for the cryptocurrency.
QTUM/USD technical analysis
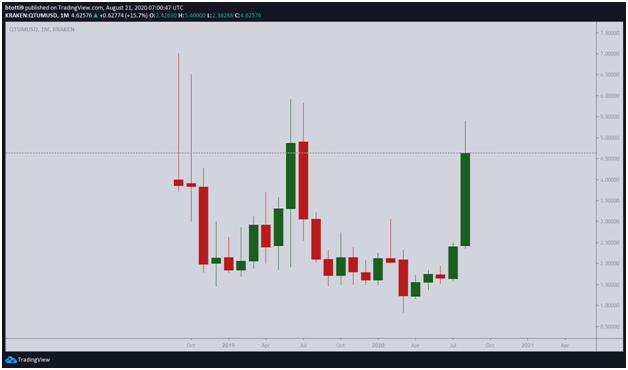
QTUM/USD traded at around $2.46 on August 1 but skyrocketed this week to see it touch its highest price since trading at around $5.60 in July 2019.

On the technical side, QTUM/USD breached several resistance levels in surging to its YTD high price. However, bulls encountered a tougher hurdle at $5.40, likely to have been traders taking profits by selling their holdings.

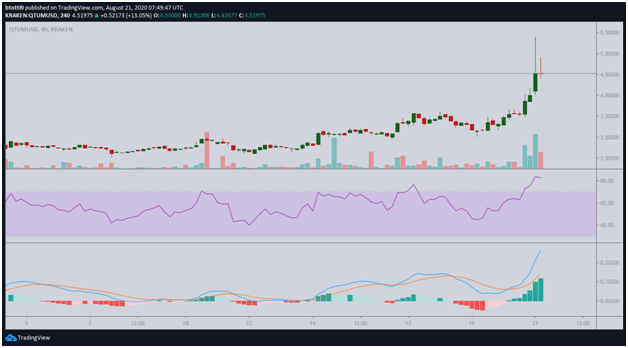
This has since seen the token retrace slightly to currently trade at around $4.85. While bulls retain the upper hand, the lack of substantial support zones between $3.50 and $5.00 means the path of least resistance is downwards.
The RSI is in overbought territory on the 4-hour chart but is beginning to drop off. However, the MACD is firmly bullish to suggest bulls still have control.
An uptick in later sessions is likely to see bulls attempt to retake the resistance wall at $5.00 and $5.40. In any case, a bearish move would take prices to the major support area around $3.48. This is a supply zone that has been created after demand saw buyers push QTUM/USD from lows of $2.40.

