Bulls need to break above the 20-day simple moving average to avoid more lossses
SafeMoon is trading around $0.00000214 at time of writing, with data from CoinGecko showing that the token's price has gained by 3.6% in the past 24 hours.
However, despite turning green on the day, SAFEMOON has not shaken off the bears and the constricting descending triangle pattern suggests the next move could be a dip to critical support levels. An upward move on the other hand could see bulls seek fresh gains towards $0.0000029.
SafeMoon technical outlook
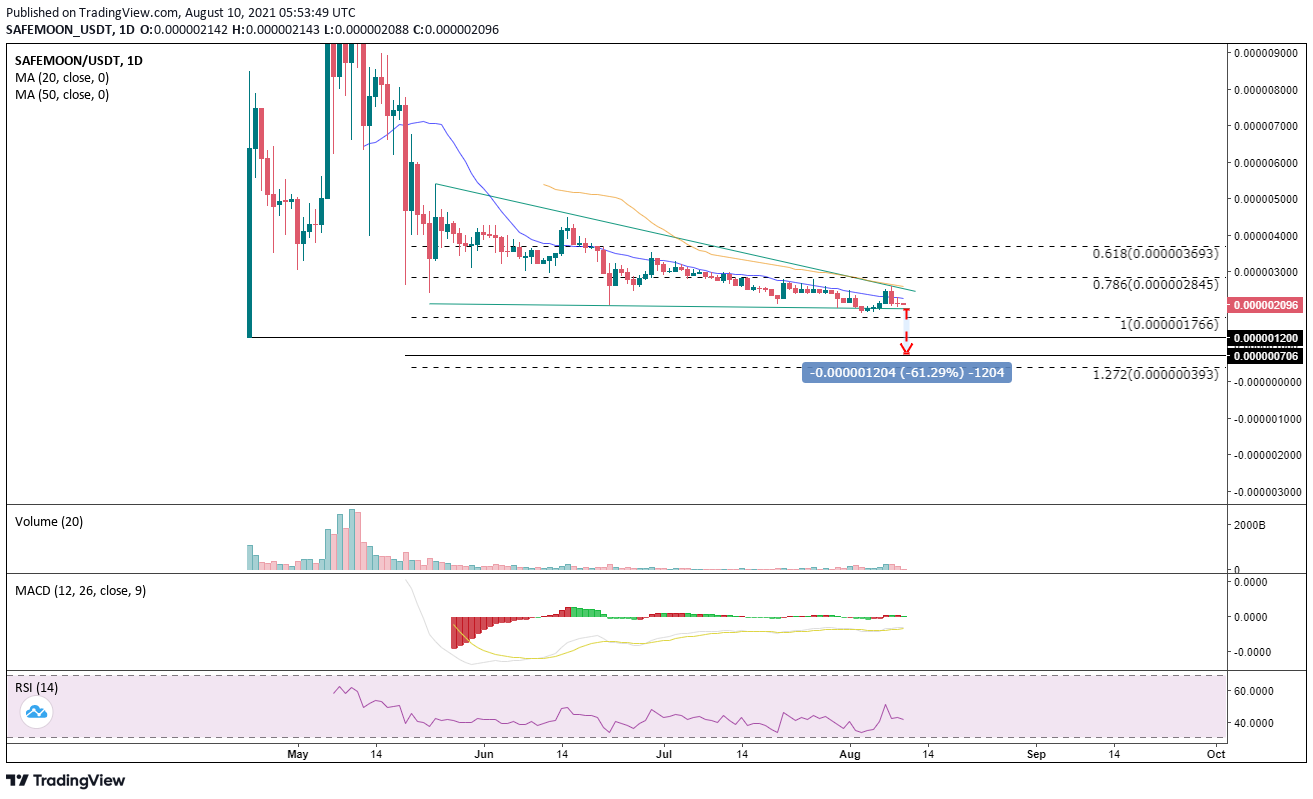
SAFEMOON has an intraday range of $0.0000020-$0.0000022 as bulls seek to bounce off the descending triangle support line at $0.0000020.
The daily chart shows that SafeMoon has traded within a descending triangle pattern since the breakdown from highs of $0.0000078 on 19 May. The pattern presents a bearish outlook that threatens new losses.
We have the daily Relative Strength Index (RSI) below the 50 point line, while the daily moving average convergence divergence (MACD) line is in the bearish zone. Lacklustre volume and the sloping curve of the 20 SMA are also presented as a bearish factor for SafeMoon price.
If the price turns lower and slides below the support trendline of the descending triangle pattern, bulls face a 61% decline. This would take SAFEMOON below support at $0.0000012, opening up losses to lows of $0.0000007 and the 127.2% Fibonacci retracement level at $0.0000004.
SAFEMOON price daily chart. Source: TradingView
If the upside seen in morning deals this Tuesday continues, there are chances bulls might test the resistance level at the 20-day simple moving average at $0.0000023. The token's price could then move towards a horizontal resistance line at $0.0000025 before a breakout above the trendline of the descending triangle pattern likely fuels fresh interest.
The next barrier is at the 50 SMA ($0.0000026), with the main target then being the 78.6% Fibonacci retracement level at $0.0000029.

