XLM price is struggling against bearish pressure near $0.3700, with sellers having revisited lows of $0.3560
Stellar‘s XLM is trading around $0.3789 at the moment, with bulls fighting to keep prices near the main support level at $0.3800. Over the past 24 hours, XLM price has slid 4.72% and could see more losses if sellers continue to exert downward pressure.
However, there is the possibility of bulls stemming the decline around $0.3700. This could invite more buyers and see XLM/USD start a strong upside towards the critical resistance levels at $0.4060 and $0.4400.
Stellar (XLM) price outlook
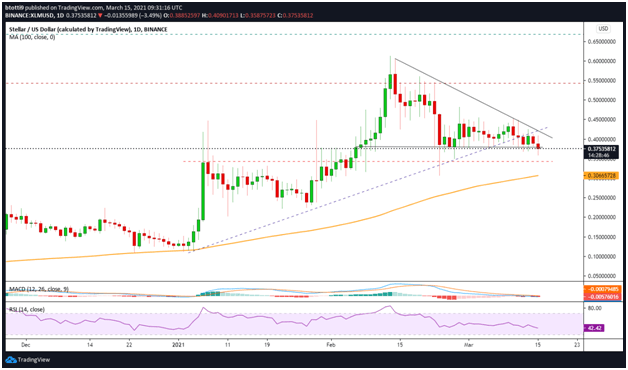
XLM/USD has faced increased selling pressure since hitting highs of $0.61 in February. The short-term technical picture for XLM suggests a bearish flip. The perspective has strengthened after bulls failed to break resistance at $0.4000 over the weekend, with sellers pushing prices below a long term bullish trend line on the daily chart
The XLM/USD pair is also trading near the tip of a descending triangle pattern, which suggests a downward continuation.
The daily RSI and MACD suggest bears hold the upper hand and could look for more damage over the next few days.

If the short-term picture remains bearish, Stellar’s price could see further declines below the $0.3750 level. Primary support is at the $0.3410 horizontal line, but if bearish pressure leads to a spike below $0.3400, the next major support area is at the 100-day simple moving average ($0.3066).
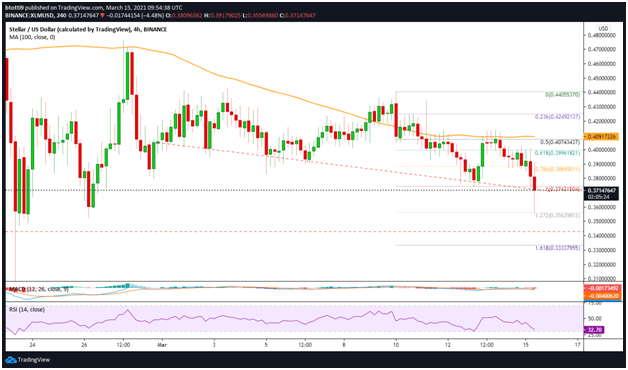
On the 4-hour chart, Stellar’s price has seen fresh declines below the 100 SMA ($0.4091). The pair has even broken below a downtrend line with support at $0.3700, touching lows of $0.3560.
The MACD indicator suggests the XLM/USD pair is facing an uphill task to regain upside momentum. The indicator has crossed below the signal line and is looking to strengthen within the bearish zone. The RSI on the 4-hour chart also suggests sellers have a slight advantage as the indicator hovers below the midpoint, currently printing 32.70

If the price continues lower, the next target could be $0.33, which is located near the 1.618 Fib level of the downswing from $0.4405 high to $0.3743 low. Further losses will invite extra sell-off pressure likely to push XLM/USD towards the crucial $0.3000 level.
In case bulls keep price above $0.3700 and breach resistance at the 0.786 Fib level ($0.3884), an upside could resume. However, bulls will have to break clear of $0.4074, the price level marked by the 0.5 Fibonacci retracement level of the aforementioned price swing. The next target above this price level is $0.4249 and then $0.4400.

