

XTZ nosedived nearly 30% on Tuesday, retracing sharply from highs of $4.29 to $2.93 as crypto bloodbath wiped off recent gains
Tezos (XTZ) plunged nearly 30% yesterday after a sharp correction across the crypto market, fueled by Bitcoin‘s dip below $50k to lows of $45,000. XTZ, which had been looking to retest resistance above $4.30, plummeted to lows of $2.90.
The decline threatened to send Tezos price off a cliff before two consecutive green candlesticks on the 4-hour chart pushed XTZ/USD to highs of $3.70. Bulls are looking to extend the upside momentum, with Tezos trading around $3.74 on major exchanges as of writing.
While Tezos remains 33% off its all-time high of $5.58 reached on 14 February 2021, positive momentum could see it break above a key resistance zone.
Tezos price technical outlook
The technical picture for Tezos suggests a positive trend is likely, given an uptick in sentiment over the past 12 hours.
The MACD indicator remains in the bearish zone, but there’s a hint of a bullish crossover from below the signal line. The weakening bearish outlook as shown by the decreasing histogram indicates a potential spike in buying pressure.
The Relative Strength Indicator (RSI) is also looking to flip upward from the bearish zone. The indicator currently reads 44 but has a positive divergence to suggest bears could be losing their grip.
The XTZ price is also above the SMA-200 ($3.68), which means bulls have a strong initial support level if they fail to establish an upside. If bulls can breach the resistance at the 0.618 Fibonacci retracement level of the downswing from $5.14 high to $2.93 at $3.79, the next hurdle is at the 0.5 Fibonacci level at $4.05.
If the upside momentum holds and XTZ moves higher, buyers can target a horizontal barrier at $4.30. Above this level, Tezos price could rally to key resistance at the 0.236 Fibonacci level currently located at $4.62. Retesting the zone on an upward trajectory could see bulls aim for $5.00 and then potentially the all-time high.
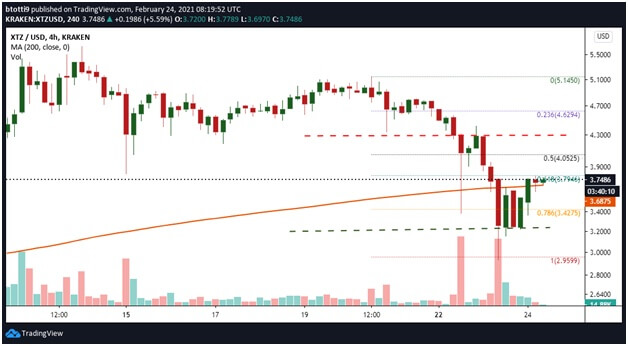
On the downside, diving below the SMA-200 would be a first signal that bears aren’t finished yet. If there’s a fresh downside to $3.42 (0.786 Fib level), sellers could increase their orders and overpower bulls. In this case, we could look at XTZ’s price dropping to recent lows at $2.93.