Tezos (XTZ) has been trading in an ascending trend since 3 January. However, its price is now at a pivot point and XTZ is fighting to stay in the trend
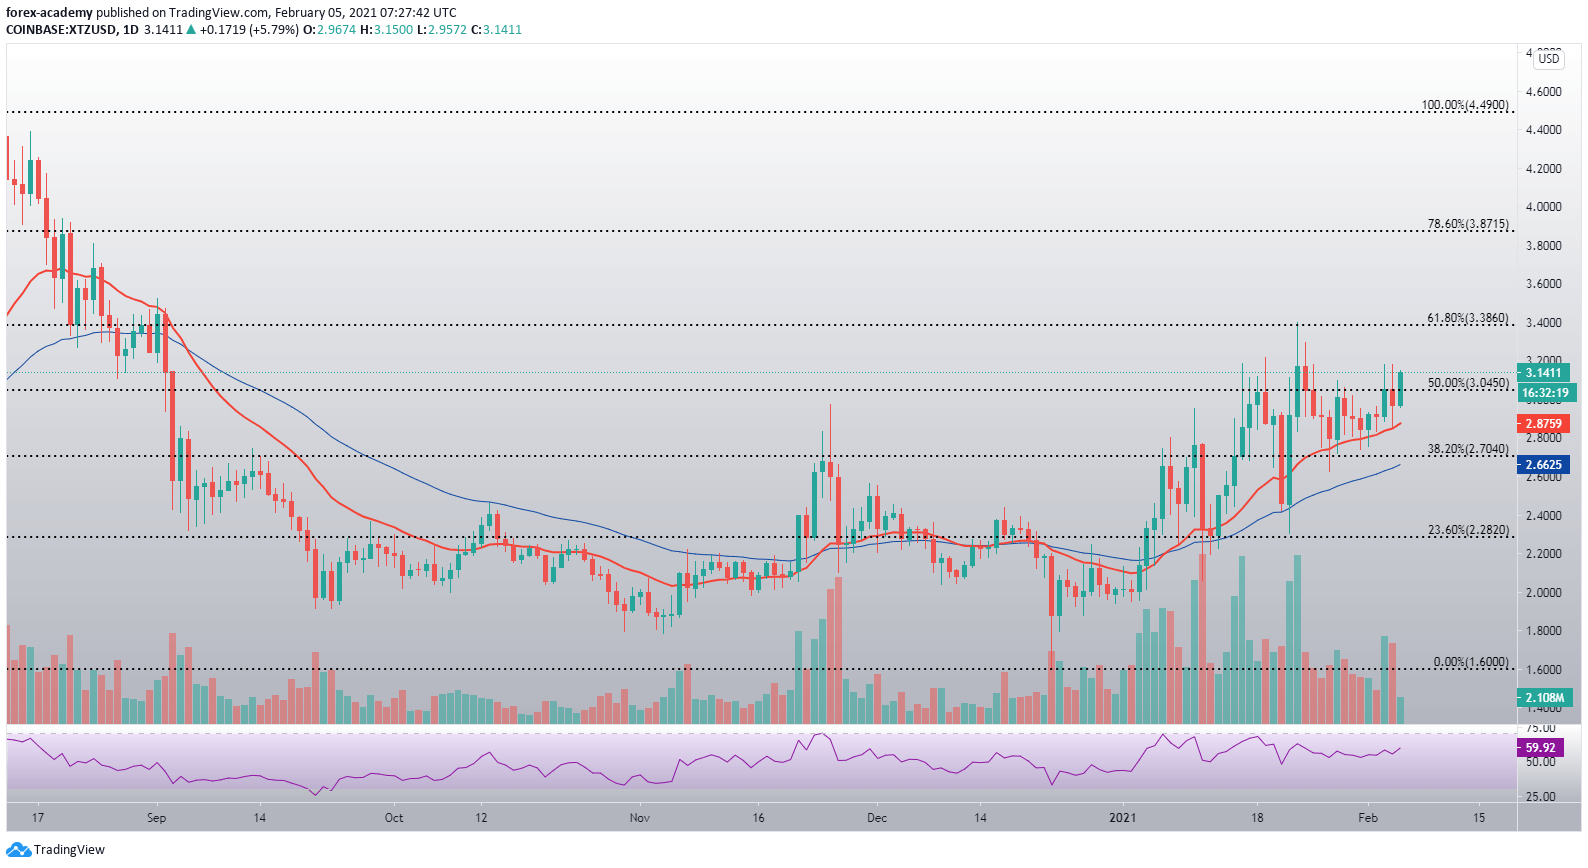
Tezos is closely following its daily 21-day EMA support line to the upside, but might soon reach a heavy resistance level.
Tezos fundamentals and past price performance
XTZ managed to score a week-over-week gain of 8.22%. When compared to other cryptocurrencies, BTC posted weekly gains of 15.04%, while ETH managed to gain 26.85% over the same period.
At the time of writing, XTZ is trading for $3.14, which represents a price increase of 16.03% when compared to the previous month’s value. Tezos is currently the 25th largest cryptocurrency by market cap, boasting a value of $2.63 billion.
XTZ/USD daily chart price breakdown
Tezos (XTZ) has been moving up on increased volume ever since 3 January. However, the recent (though small) descent in volume and volatility indicated that a major move is in preparation. While analysts are uncertain on the direction of the move, many are calling for a break to $3.18 and a push past the $3.38 level, while others call for a retest of $2.
In any case, Tezos’ downside is well-protected by the 21-day EMA, which will be very hard to push past.

XTZ/USD daily price chart. Source: TradingView
Tezos’ RSI on the daily timeframe has been in the upper part of the value range for quite a long time now, with its current value sitting at 59.92.
XTZ/USD hourly chart price breakdown
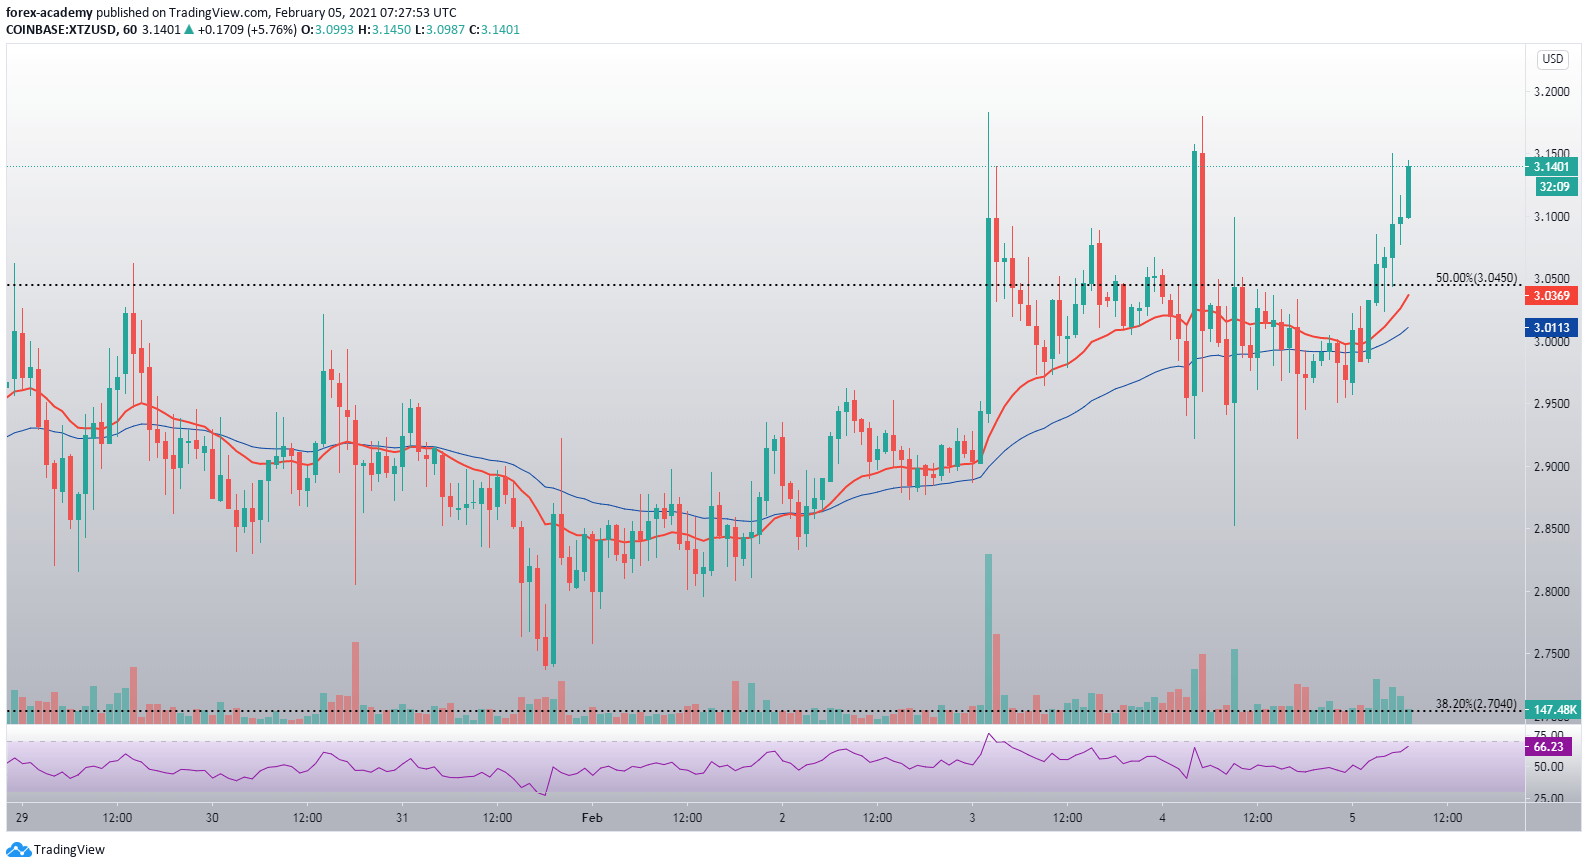
XTZ’s hourly chart shows us a very interesting trading pattern that has occurred. Tezos has had numerous surges in volume over the past couple of days, but failed to break the $3.18 level each time. Its price is currently contesting this resistance level, which we may also call a pivot point.

XTZ/USD 1-hour chart. Source: TradingView
A push past $3.18 will certainly bring more bulls to the market and propel the price upwards, while a failed push will trigger yet another pullback.

