


Tron price is up more than 5% on the day to see buyers take charge above a support area that marks the lower boundary of the June 8 highs of $0.018
The price of Tron (TRX) is in an uptrend, with a daily surge that has seen the token upstage most altcoins in the top 30 by market cap. As of writing, the digital asset is up by more than 5.6%. The upside is a continuation of early morning trades that have seen bulls aim for higher gains. It also helps the TRON market continue an uptrend that has been forming since June 28.
A peek at the charts shows that TRX/USD is seeing the latest uptick on increased buying volume. It is a scenario likely to bolster the Tron market and offer bulls a strong support base, should price return to July 5 lows around $0.0150.
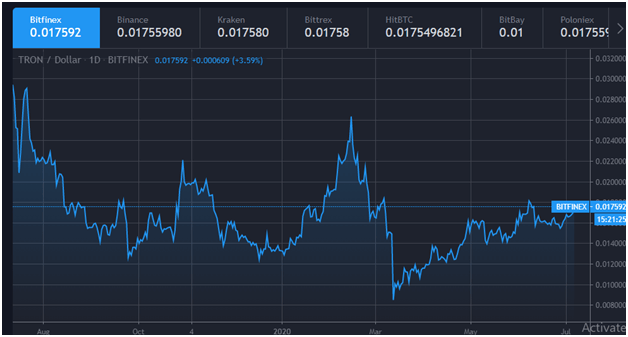
The traction evident in the Tron market has already seen bulls test a new weekly high. The influx of buyers seen since Saturday has meant that the attendant price action during today’s Asian trading session pushed the TRX/USD value to highs of $0.0177 — within reach of intraday highs above $0.018 seen in June.
With the rest of the market indicating that buyers are taking control, Tron’s price against the US dollar could test a new multi-month high near term. A continuation of the uptrend, therefore, brings into the picture $0.0188, last seen before March.
Tron price charts
The jump from recent lows of $0.0150 means that Tron’s price has broken above consecutive resistance levels. Yesterday’s daily close at $0.0168 was significant as it saw the TRX/USD pair break out of a bearish trendline. As of now, the coin is trading above the 100 SMA as seen on the 4-hour chart.
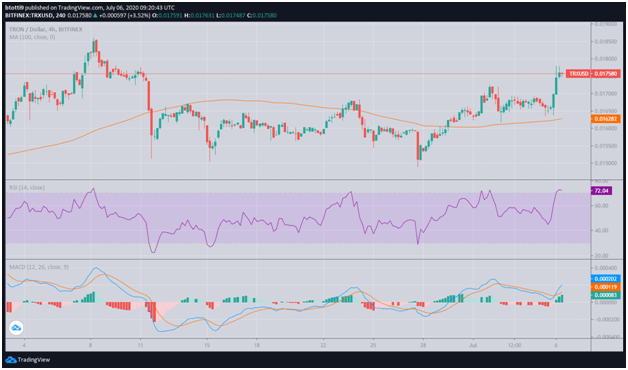
The bulls must aim for a sustained surge to keep initial support at $0.0170. This area is marked by the 23.6% Fibonacci retracement level, which is the level seen as bulls pushed prices from a low of $0.0160 low to the weekly high of $0.0177. A further breakdown has healthy support at $0.0165 and $0.0160 of the aforementioned zone.
The upside is however likely to face a strong seller wall around $0.0180. If bulls crack this, relatively weak resistance above $0.0188 will open up $0.020 in the short term.