XRP price looks to rebound above $0.40 following massive pump and dump
The Ripple (XRP) price has recovered above $0.37 to see bulls eyeing an upward extension towards recent highs.
The cryptocurrency is up about 4% in the past 24 hours, with its price action in the green following Monday’s pump and subsequent dump.
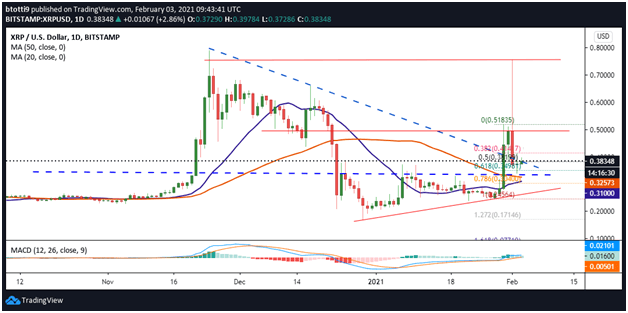
At the time of writing, XRP bulls are looking to retest resistance at a key price level near $0.40. The move could help buyers establish some breathing space above the crucial 50-SMA support. The move also places XRP price just above a descending trend line, above which XRP/USD could rally to a new intraday high.
XRP/USD price outlook
As noted, XRP/USD is looking to underpin its bullish outlook above the downsloping trendline on the daily chart. The line had acted as a strong barrier to buyers’ moves prior to Monday’s mega pump.
As it dumped, XRP broke below $0.41, a support level marked by the 0.382 Fibonacci retracement level of the swing from $0.24 low to $0.518 high. The next to give way was the support at $0.38, which coincides with the 0.5 Fibonacci retracement level of the same upswing move.
Bears, however, appeared to run out of steam just below the 0.618 Fibonacci retracement level at $0.34, allowing bulls to arrest the decay around $0.32.
The upside seen over the past few hours has XRP price above the 0.618 Fib level, which leaves the 0.5 Fib level as the immediate hurdle.

The daily chart has the RSI suggesting a hidden bullish divergence as it stays above the 50 line. The MACD is also within the positive zone, though bulls might need to hold off bears on increasing buy volume to keep it bullish.
The potential for a golden cross, as suggested by the curves of the 20-SMA and 50-SMA, also adds to the positive feel about Ripple’s XRP short term.
If the upside correction continues and bulls crack the $0.4000 hurdle, a move to the $0.50 threshold will likely call for more buy orders. A run to the $0.518 top reached before the pump could signal a bullish flip towards the 17 December 2020 peak of $0.65. Short term, the next target would be the 24 November 2020 intraday peak of $0.79.
On the downside, XRP/USD could get bearish if prices drop to the horizontal support line at $0.33. A breakdown to the 50-SMA ($0.325) and 20-SMA ($0.310) could see bears target the ascending trend line support recently formed on the daily chart.
The anchor is at $0.30, which bulls would have to defend aggressively to prevent a retest of $0.24 and $0.22.

