Ripple (XRP) traded around $0.27 at the start of last week before jumping nearly 70% to highs near $0.50
Ripple (XRP) posted the biggest weekly gains among the top ten cryptocurrencies this past week. After rallying to highs of $0.47 on 21 November, panic selling seemed to strike as the next candlestick touched $0.496 and $0.40 before settling around $0.45 yesterday.
Overall, at the time of writing, XRP is trading above $0.46 and is up over 70% in the past seven days. The upside means XRP/USD is changing hands at price levels last seen around June 2019.
XRP/USD
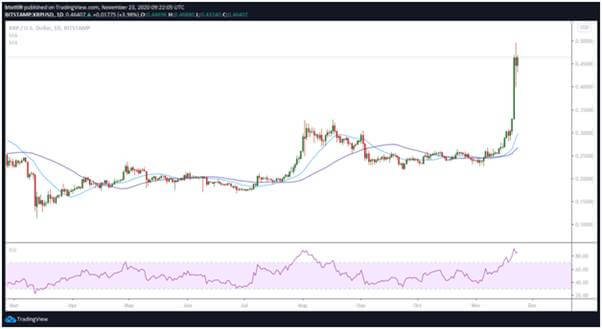
While the uptrend did somewhat cool off, the short term picture for XRP/USD suggests bulls might yet push higher. The scenario is likely to unfold if bulls continue to hold above $0.45 in the next few sessions. A repeat of the strong bullish momentum seen over the past week could offer buyers an opportunity to push for highs near $0.50.
Currently, XRP/USD is trading above the 78.6% Fibonacci retracement level ($0.45) of the swing from $0.49 high to $0.39 low. If bulls keep Ripple above this resistance-turned-support area, the buffer it provides will help buyers to fashion an assault on the psychological level of $0.50.
Success at breaking above the $0.50 barrier on an upward momentum might push XRP/USD to $0.60. From here, bulls will target the $0.75 area (September 2018 highs).
 XRP/USD daily price chart. Source: TradingView
If that fails, bears could first push prices to Sunday’s peak around $0.43 before attempting further damage to $0.40. The support at $0.43 is just above the 61.8% Fibonacci retracement level, while the latter is near the 38.2% Fibonacci retracement level of the swing from $0.49 high to $0.39 low.
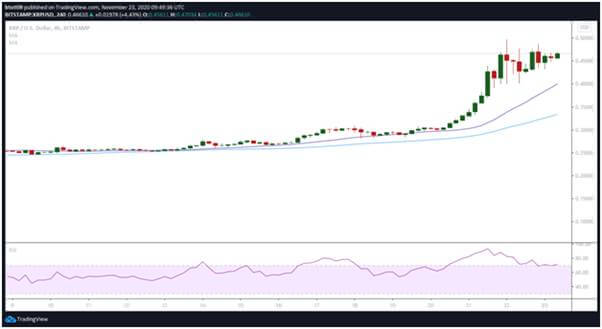
 XRP/USD 4-hour price chart. Source: TradingView
The 4-hour chart shows that bulls remain strong above $0.40 as the RSI holds fort above the 70 line. Bulls have the upper hand as long as they keep prices above $0.45.
However, with bears making it hard to break overhead resistance around $0.47, a retest of the $0.49 level might prove a bit challenging.
This outlook is likely to push XRP/USD into sideways trading, mainly because traders might look to take profits at every opportunity on the upside. In this case, the short term picture could include XRP correcting to the 20-SMA ($0.40) and then the 50-SMA ($0.33).

