The yearn.finance token has traded lower since breaking below $20,000
While Bitcoin looks to strengthen above $13,000, the price of decentralised yearn.finance token (YFI) is likely to trade lower in the next few sessions. The technical picture suggests the bearish outlook of the past few days for yearn.finance is likely to persist near term.
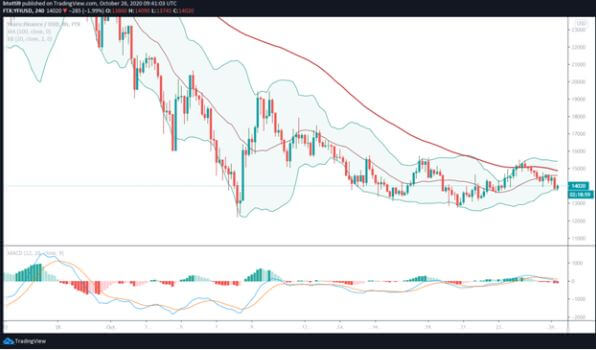
At the time of writing, the DeFi token is trading around $14,020, almost unchanged in the past 24 hours. But the token’s price has touched lows of $13,745 to suggest that the bulls might be tiring after last week’s attempt to push higher stalled around $15,505.
YFI/USD price outlook
Yearn.finance has lost 4.5% of its value in the past week, but it’s close to 75% down since hitting a new all – time high. An overall bearish outlook for the YFI/USD pair has formed following a month long downtrend in place since mid – September.
A brief upside saw the bulls break above the descending triangle pattern, but it looks like the momentum will not hold. In this case, a continuation of the downward pressure risks handing control to the bears, an eventuality that will likely plunge YFI/USD to lows of $13,500.
On the 4 – hour chart, the MACD is bearish while the RSI is suggesting an uptick though remains below the 50.00 point. However, the YFI price is near the lower curve of the Bollinger Bands and bulls need to push higher to remain in control. The primary target would be the 50 – SMA level at $14,283.
Above this level, the next resistance line is at the 100 – SMA, sandwiched between the midline and the upper curve of the squeeze.

But the 100 – SMA provides tough resistance and with the price just above $14K, it means the lack of any meaningful support could see the token plummet to lows of $13,500. Added sell – off pressure at this level will open up further declines to $13,000.
On the daily chart, a bullish divergence for the MACD suggests bulls might be having a slight advantage after last week’s bounce. The outlook is supported by the considerably squeezed Bollinger Bands. But three bearish candlesticks means that YFI/USD has limited its price action near the middle curve.
A breakout will likely see YFI/USD rebound to highs near $14,900. If the bulls recapture the psychological $15,000 level, a run to $20,000 would likely materialise.

