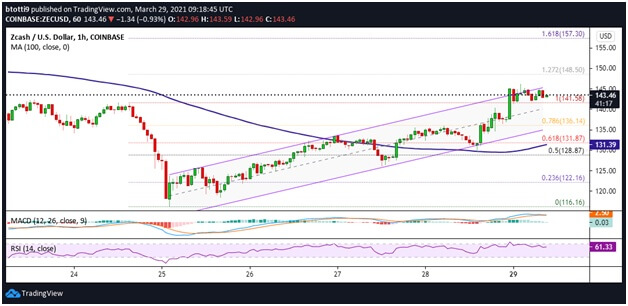
Zcash saw its price recover nearly 18% after crashing to lows of $116
The price of Zcash (ZEC) has increased by over 7% in the past 24 hours to see the privacy focussed coin trade around $144. Although it remains in the red over the week, the current technical outlook suggests further gains.
If this happens, ZEC/USD is likely to turn green and allow bulls to retest resistance around $150.
The uptick in sentiment for Zcash follows a similar perspective for several other altcoins. Stellar (XLM) is up 4%; Litecoin (LTC) has gained 4.8%; Polkadot (DOT) is up 3% and Theta (THETA) remains positive among the top 10 cryptocurrencies with an upside of 8%.
ZEC price

Zcash has been trading higher over the past three days. The coin’s price reached a low of $116 on 25 March, having seen a sharp decline from highs of $141 over 24 hours.
The last three days have however seen bulls push higher. If we chart the higher lows and lower highs using trend lines, we have ZEC trading within a rising channel on the 4-hour chart.
Yesterday, Zcash gained 5% and broke above the channel’s upper limit to touch highs of $145. The presence of bears nonetheless meant a swift retreat to support near $140. Bulls have sought to rally higher today, but seller congestion in the $144—$145 region continues to cap immediate action.
The technical picture slightly favours the buyers. It’s an outlook informed by the hourly RSI that hovers above 60 and an hourly MACD that remains within the bullish zone, despite a hint of negative divergence.
If Zcash’s price rallies above the $145 resistance line, a new high near the 127.2% Fibonacci retracement level could open up a run to $150. From here, bulls can target the 161.8% Fib level of the decline from $141 to $116.
On the downside, ZEC/USD has an initial anchor at its previous resistance-turned-support level at $141. Below this, further selling could allow sellers to target prices near the 78.6% Fibonacci retracement level ($136) and then the 100 SMA ($131).
The 23.6% Fib level ($122) and $115 are the key price levels to watch, in case there is further damage below $130.

