Bitcoin has dipped below $48,000, Ethereum is retesting $1,500 and Binance Coin is at risk of diving below $200
While BTC is fighting to keep prices near $50k, Ethereum has dived to lows of $1,500 and BNB has seen a sharp sell-off to lows of $206.
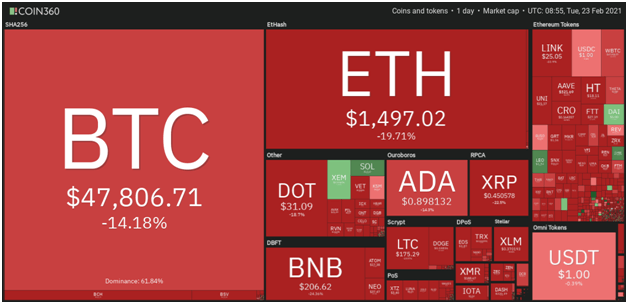
As the cryptocurrency market map below shows, most coins are in deep red and profit-booking appears to pose a risk for more downside movement.

Here’s a technical outlook for the top three cryptocurrencies by market cap.
BTC/USD
According to on-chain data analysts at Santiment, Bitcoin’s sudden collapse comes after an equally sudden increase in exchange inflows.
Bitcoin corrected 16% immediately after “the largest one-hour exchange inflow” in four months.
“Bitcoin’s whales were connected with this slide, as the amount of addresses with at least 1,000 $BTC dropped from 2,462 a week ago to now 2,416 (-1.9% drop),” the firm explained.
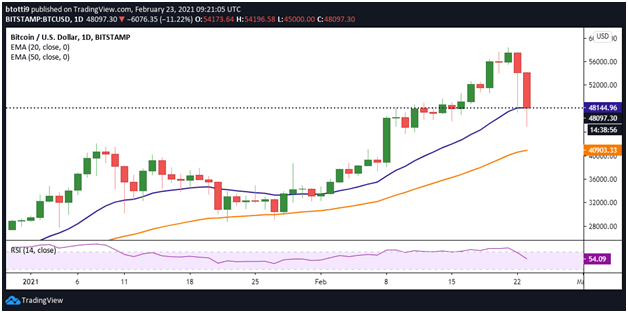
On the daily chart, BTC price has declined to lows of $45,200, and bulls’ attempts for an immediate recovery have failed to ignite any meaningful upside.

BTC/USD is looking to stop the decline at the 20-day EMA ($48,144), which could help bulls advance towards the $50,000 mark in the short term.
On the contrary, another dip to intraday lows of $45,200 could jeopardise chances of a fresh upside. If bulls fail to keep prices above that level, a further sell-off could push it towards the 50-day EMA ($40,903).
ETH/USD
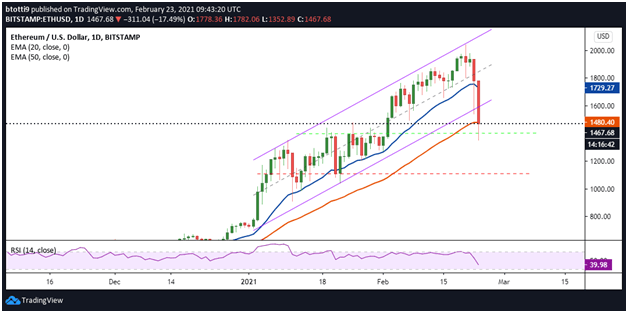
Ethereum price has retested lows of $1,352 after increased sell-off pressure pushed it past the support line of an ascending channel. The ETH/USD pair broke below the 20-day EMA ($1,729) and then the 50-day EMA ($1,480).
The long tails on the two red candlesticks suggest bulls are aggressively trying to buy the dip. If they manage to rebound and register a daily close above the 20-day EMA, a fresh upside could see ETH push towards recent highs again.

On the flip side, Ether (ETH) below the 50-day EMA ($1,480) will likely invite more downward pressure and see bears target lows of $1,300 and then $1,100.
BNB/USD
Binance Coin (BNB) price has fallen sharply and could see the cryptocurrency slip lower among the top altcoins by market cap after ranking as high as 3rd.
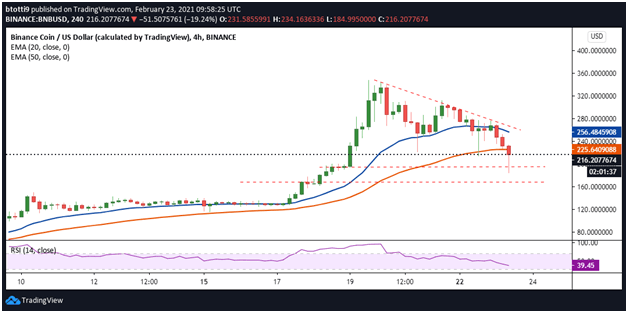
Like BTC and ETH, BNB has faced huge pressure from profit-booking trades and currently trades around $213. It means bears have pushed prices below both the 20-day EMA ($256) and 50-day EMA ($225).

Bulls need to retake the above price levels to reestablish their advantage and aim for more gains.
On the contrary, if BNB/USD sinks below $200, the initial cushion is at $194. Below this level, more losses could take Binance Coin to the major horizontal support line at $168.

