Bitcoin touches a high of $10,336 and could climb higher to the $11,000-$12,000 range over the short term
Bitcoin price has raced to a high of $10,333 on Monday morning and looks set to crack higher levels. This comes after bulls rallied over the weekend following weeks and weeks of price failing to break through resistance at around $9,500.
The upside isn’t entirely surprising given a breakout had looked imminent once Bitcoin price moved above the $9,000-$9,400 range for the first time in several weeks.
Bulls then quickly established a footing above $9,500, and it appeared just a matter of time before increased buying pressure helped push prices higher.
The ranging between $9,600 and $9,900 over the weekend aided buyers in the impressive run to Sunday’s highs.
As of writing, Bitcoin is exchanging hands at around $10,280.
The BTC/USD pair surged by more than 6% today, suggesting that a repeat of the last few days’ price action could send Bitcoin higher — possibly targeting $11,000-$12,000 short term.
Elsewhere, gold has risen to record highs near $1,950 although growing geopolitical tension between the US and China could scamper chances of higher gains.
Hodlers not selling yet
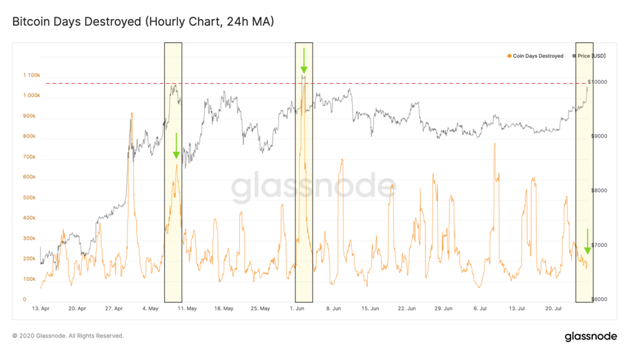
According to Glassnode, the bulls latest attempt to rally price above $10K could be unlike the rallies seen around the time of Bitcoin’s halving in May.
A chart the platform shared suggests a super bullish scenario due to an indicator dubbed the Bitcoin Days Destroyed (BDD).
BDD focuses on the number of bitcoins in a transaction and the period it has taken them to move or be spent. In the past few months, attempts to crack resistance above $10k have coincided with a spike in value for the indicator. The suggestion was that BTC/USD above $10k had so far been a trigger for hodlers to sell.
Yet, Glassnode data shared on Twitter in the aftermath of BTC/USD hitting $10k, the latest surge in price hasn’t triggered sellers into increased action as one might expect.

Bitcoin technical perspective
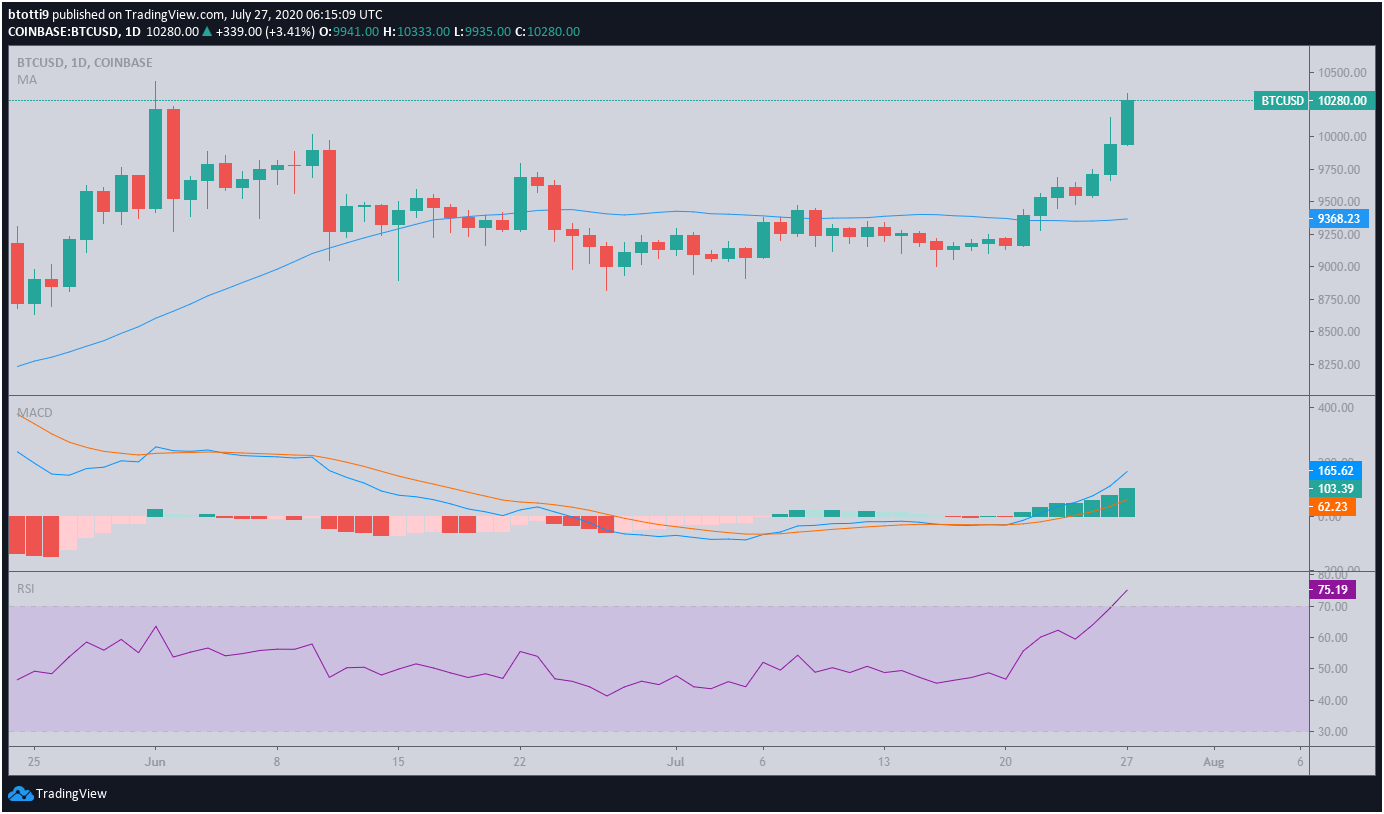
Bitcoin price tested a high of $10,147 before a slight retreat saw sellers take it to lows of $9,964. Buyers quickly recaptured $10k and have pushed to intraday highs of $10,306 as of press time.
Buyers need to strengthen support in the five-figure range to prevent a breakdown to the compression triangle that restricted prices for several weeks prior to last week’s breakout.

The bullish scenario is likely to prevail given the RSI holds above 70 with no suggestion of bearish divergence being in overbought territory. A similar case is strengthened by the bullish divergence of the MACD.
Bulls might look to the increasing volatility and strong institutional interest to aim for a series of higher highs (with higher lows). If BTC/USD fails to hold $10k again, a reversal might take the price to around $9,600 and the 50-day MA at $9,358.

