BTC/USD price jumped more than 6% to touch highs of $12,314
Bitcoin price broke above $12,000 to hit an intraday high around $12,314 and although prices have retreated slightly, the next target is the 2020 highs around $12,500.
At the time of writing, BTC/USD is trading around $12,279 but is looking strong on the 4 – hour and daily charts.
Traders should recall that when Bitcoin crossed the $12k price level again in August, several analysts predicted that the bull cycle would feature multiple pullbacks of 20%. The latest leg of the correction saw Bitcoin drop to prices around $9,800.
From a technical perspective, where BTC/USD trends next depends on whether the current upside takes prices above the crucial resistance area around $12,500 or whether another rejection stalls the forecast bull run.
Analysts predict Bitcoin’s uptrend to continue
Analysts say Bitcoin’s technical picture suggests a higher close on both the weekly and monthly charts.
According to Blockroots.com co-founder Josh Rager, “Bitcoin hasn’t had a weekly close above $12,000 since January 2018”.
The rebound seen over the past few weeks, however, follows a recent 20% pullback, which the analyst says is a signal that Bitcoin is ready to “continue this uptrend”.
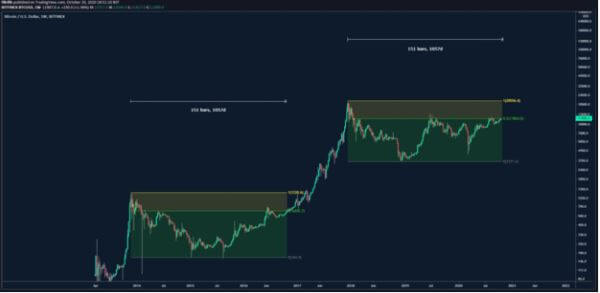
His sentiments are shared by the pseudonymous trader Filbfilb, who suggests that BTC has a “cyclical” price trajectory that is “difficult to escape from”.
In a tweet to more than 48.5K of his followers, the trader advises:
“Same week 4 years ago, Bitcoin was trying to finally break the 50% bear market fib retracement. It never looked back after that & tested ATH by January”.
According to Filfilb, Bitcoin has taken roughly the same number of days (1,057 days) to break above the 50% retracement level as it did before its last major bull run.

BTC price chart comparing 2017 trajectory and 2020 scenario. Source: Filbfilb on Twitter
Does this mean that BTC/USD will rip even higher? It appears so, with social sentiment turning extremely bullish, even as altcoins bleed on a BTC/USD surge.
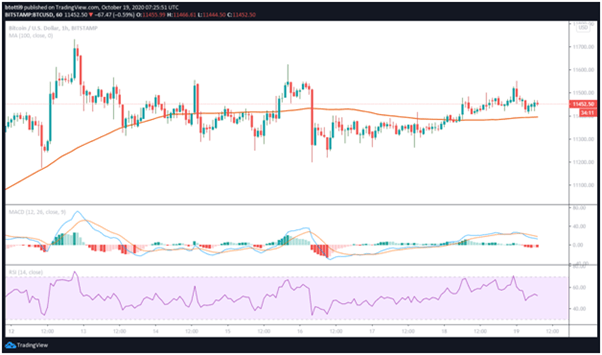
The 4 – hour chart for Bitcoin shows that BTC/USD has healthy support at the SMA50 and SMA100 near $11,550 and $11,246, respectively. The RSI is slightly extended but isn’t hinting at a bearish divergence, while the MACD is super bullish.

Bitcoin price 4 – hour chart. Source: TradingView
The 1-hour chart, however, shows a dip in buying pressure over the past two hours. However, the bullish outlook will remain in place if the price stays above the SMA50, SMA10 and SMA200.
As noted above, the technical picture will strengthen if the price breaks above the crucial $12,500 resistance. The area has proved stubborn before and a sustained breakout to higher levels could bring into play attempts at the next resistance line around $13,800.

