Keeping prices above $11,400 is important if bulls need to break $11,600 – the last major hurdle to $12,000
After a turbulent few days, Bitcoin price spiked past $11,500 over the weekend before slowing down towards the weekly close on Sunday night. Despite the pause, the chance that the price breaks above the $11,600 level and head for the psychological $12,000 is possible if we consider three key factors.
However, that depends on where price trends, with the pivotal areas at $11,600 on the upside and $11,300 on the downside crucial to bulls and bears respectively.
Across the markets, Bitcoin bulls will likely watch out for comments from Federal Reserve chair Jerome Powell, who is due to take part in a discussion on “the benefits and risks of cross-border”. The panel is taking place today, the Monday 19th of October, as announced by the IMF last week.
BTC/USD
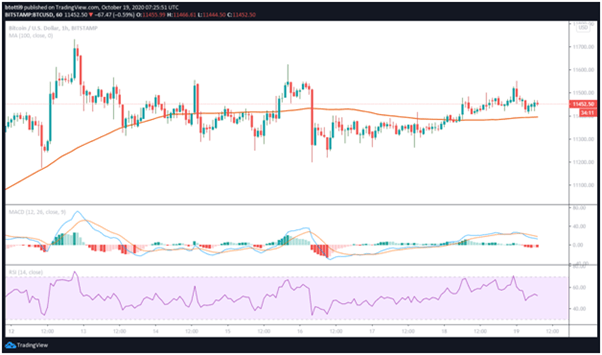
BTC/USD is trading above the 100 hourly simple moving average at $11,395, with an uptick in sentiment likely to see it stay positive going into this week.
After breaking above a bearish trend line marked by resistance at the $11,400 and the $11,500 lines, the BTC/USD pair hit its latest upside hurdle around $11,560. The correction to lows of $11,416 threatened further declines to the retracement levels of the dip to lows of $11,150 seen on Friday.
However, Bitcoin is likely to trade with higher highs on lower time frames and consolidate above a rising channel near $11,500. An extended upside will once more see BTC/USD finally breach resistance at the aforementioned level to bring into play a potential retest of $12,000.

BTC/USD price hourly chart. Source: TradingView
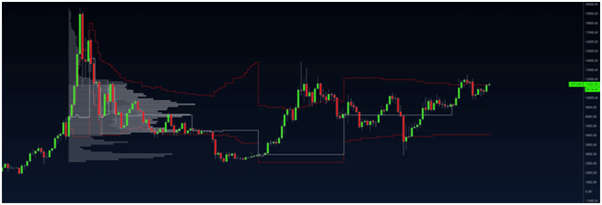
According to one analyst, Bitcoin’s current price level is important if bulls have to reach another all-time high. As shown in the chart below that the analyst shared, keeping the level or trading higher could be a key micro trend compared to the “blowoff top” of 2017 when BTC/USD raced to highs of $20,000.

Bitcoin price chart showing price distribution and the blowoff top of 2017. Source: Cantering Clark on Twitter.
Conversely, bulls will need to defend the $11,400 support line, an area marked by the 50% Fibonacci retracement level and the SMA100 on the hourly chart. Although the hourly chart features successive green candles over the past three hours, the MACD is suggesting a bearish divergence as is the RSI that is dipping with a hidden bearish outlook at 52.59.
If a breakout below the $11,400 level occurs, the next target for bears will be the $11,300 level and below that, a fight with the bulls keen on keeping the $11,000 support area.
As of writing, BTC/USD is trading around $11,452, just below the key hurdle around $11,500.

