A strong rally over the weekend pushed Bitcoin from $10,600 to highs of $11,498
The price of Bitcoin hit a high of $11,498 on Coinbase over the weekend, building on a strong rally seen late last week.
BTC/USD is now trading above an ascending triangle, with support at the breakout point likely to provide the impetus buyers need to push to $12,000. Above this level is long term resistance found at $12,500.
The top cryptocurrency is at press time trading around $11,360 but looks strong on the 4-hour chart with the previous hurdle around $11,200 now acting as the immediate support zone.
As can be seen in the daily chart below, the RSI is suggesting a legitimate breakout is in the offing if bulls stay above the ascending triangle.

Bitcoin’s price daily chart showing ascending triangle and RSI breakout. Source: TradingView
On the weekly chart, Bitcoin’s candle close at $11,374 was also indicative of the latest momentum. Although the upside has stalled around $11,300-$11,400, staying above current levels could indicate strength. As such, a break above $11,600 near-term would put bulls on course to retest resistance at $12K and then $12,500.
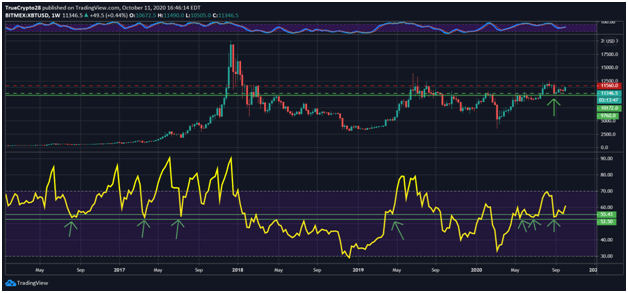
According to technical analyst Mr. Anderson on Twitter, Bitcoin has also printed a weekly RSI close that is historically bullish.
The Bitcoin enthusiast shared the chart below and noted that if the RSI pivot hits 63 on the weekly time frame, BTC/USD would be ready for another leg up.
“A few weeks ago I explained that the Bulls would defend $10.1k [because] they had to. Now BTC has given us a weekly RSI pivot that is extremely common [with] Ultra Bullish BTC moves. A weekly RSI close of 63+ has always provided another LEG up & a 70+ close gives you $16k+,” he added.

Chart showing Bitcoin price RSI on a weekly time frame. Source: Twitter (Mr. Anderson).
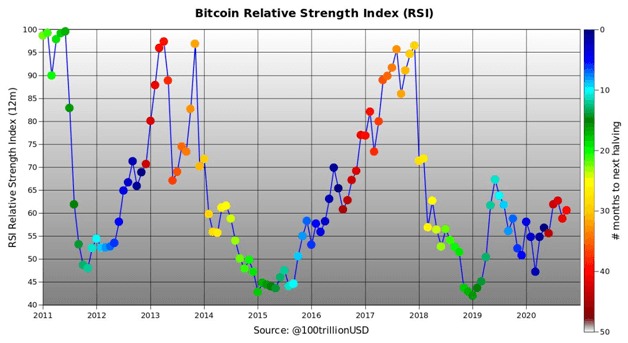
PlanB’s 12-month RSI chart for Bitcoin also shows the metric has cut back above 60.

The RSI chart for BTC. Source: PlanB
However, Bitcoin could still face a strong rejection at current levels if selling pressure increases. According to the on-chain data analysis firm IntoTheBlock, 89.28% of over 31.9 million addresses are in profit.
Per the firm, “Bitcoin has a strong bottom,” if bulls run into a strong rejection at $11,600. In that case, the area around $10,900 provides the next major protection zone.

