LINK supporters predict a $100 valuation by 2022, but how will Chainlink fare in June?
Launched in 2017, Chainlink is a blockchain abstraction layer that enables universally connected smart contracts. This is done via a decentralized oracle network. Increased demand for the protocol has seen its native token LINK grow tremendously in value, making it a top 20 cryptocurrency by market capitalisation.
Many investors and traders alike are wondering how LINK will respond to May’s market crash in the month of June. This piece will explore the current price of LINK, the events likely to push its price up, and technical analysis from pro traders on TradingView.
Chainlink Price Analysis

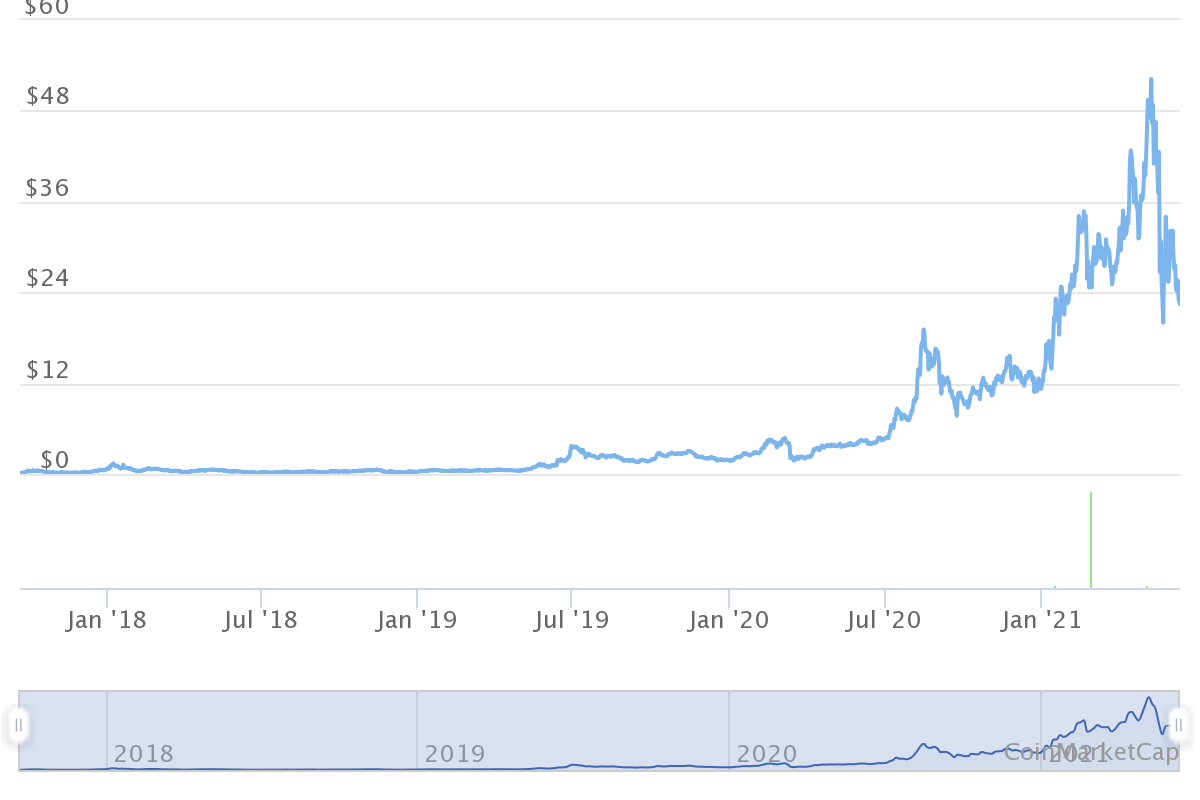
LINK 1-year price chart: Source CoinMarketCap
Looking at the crypto charts, a year ago, LINK was trading at the $4 range. Today its price lies at around $24 despite the slight decline in fortunes over the past few weeks. This means its price has already grown 6x within 12 months. This is quite impressive compared to other top coins such as BTC, which managed about 3x within the same period.
Compared to other assets outside cryptocurrencies such as stocks, commodities, and precious metals, these are the kind of gains you will have to wait for years to realise on your investment. More incredible is the coin’s ROI, which stands at 15,368% in just four years. To put this figure into perspective, if you had bought LINK worth $100 four years ago, today, your investment would have grown by 150x. These gains are never really seen outside crypto, which makes it so appealing to investors.
Where to buy Chainlink (LINK) today
Chainlink Price Factors for June
This section will cover factors that are likely to influence the price of LINK in June.
Growing Demand For Oracle Networks
The crypto market is run by smart contract platforms such as Ethereum and Binance, allowing for the building of dApps and DeFi protocols. For these protocols to execute on their own, they require data from outside and accurate information specifically. However, older generation blockchains operate as islands, and sharing this information or receiving it from an outside source is problematic.
This has created a need for oracle networks such as Chainlink to help feed various smart contracts. The growth of DeFi, which is decentralising every aspect of traditional finance, has demanded platforms such as Chainlink, Polygon, Polkadot, and others. This is one reason the tokens of such protocols are performing so well compared to the rest. As the DeFi space grows, expect to see more interest in Chainlink and its token.
The Continuation of The Bull Run
The crypto market is highly volatile, which can be backed by the fact that the entire market has shed about $900 billion over the past month. However, even if that figure seems enormous, at the current market cap of $1.5 trillion, the market is still 5x what it was over the past year.
Experts believe the bull market isn’t over yet despite the recent dip due to China’s crackdown on cryptocurrencies and woes surrounding Bitcoin, the market leader with the ability to affect the entire market. If the bull run resumes, don’t be surprised if LINK does another 6x by the end of the year, which is possible since this is one of the most in-demand protocols, as we have seen in the section above.
Investors Buying The Dip
LINK is 54% down from its all-time high of $52 attained over a month ago. The exciting thing is that institutional and retail interest is still strong on cryptocurrencies. And the price drop presents opportunities for long-term investors to add more LINK to their portfolio. Many believe that once the bull run resumes, the current price will seem like a bargain. Shrewd investors know this and will look to take advantage. Increased buying is likely to push the price up by the end of the month.
Chainlink Price Forecast
The long-term outlook for LINK looks positive, according to the majority of pro traders.

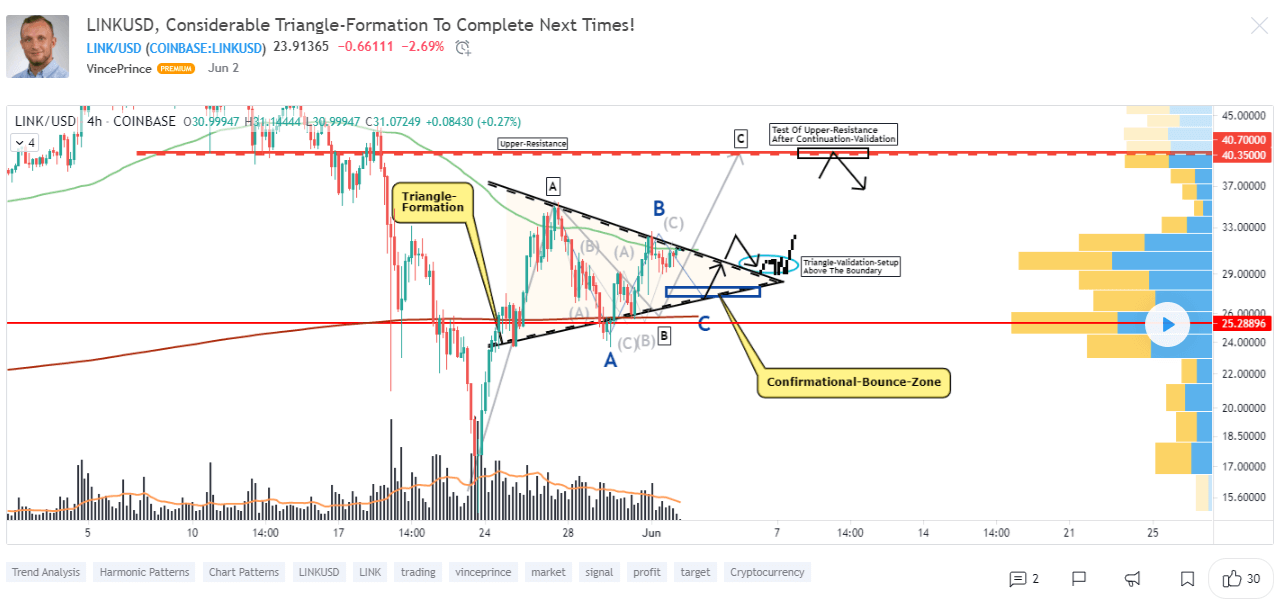
LINK 4 Hour chart: Source TradingView
In the chart above, VincePrince takes a look at the 4-hour timeframe perspectives. LINK/USD has managed to bounce in the structure and moved above important resistances within the range. It has now developed this triangle-formation above the main point-of-control within the volume profile.
LINK/USD is now about to finish the wave-count within the triangle with the remaining wave C upcoming next times, and when this C bounces sufficiently within the confirmational-bounce-cluster, this will lead to an upside-breakout above the upper boundary of the triangle, which will be the proper setup to determine further continuations and testing of the remaining upper resistance LINK/USD still has in the structure.

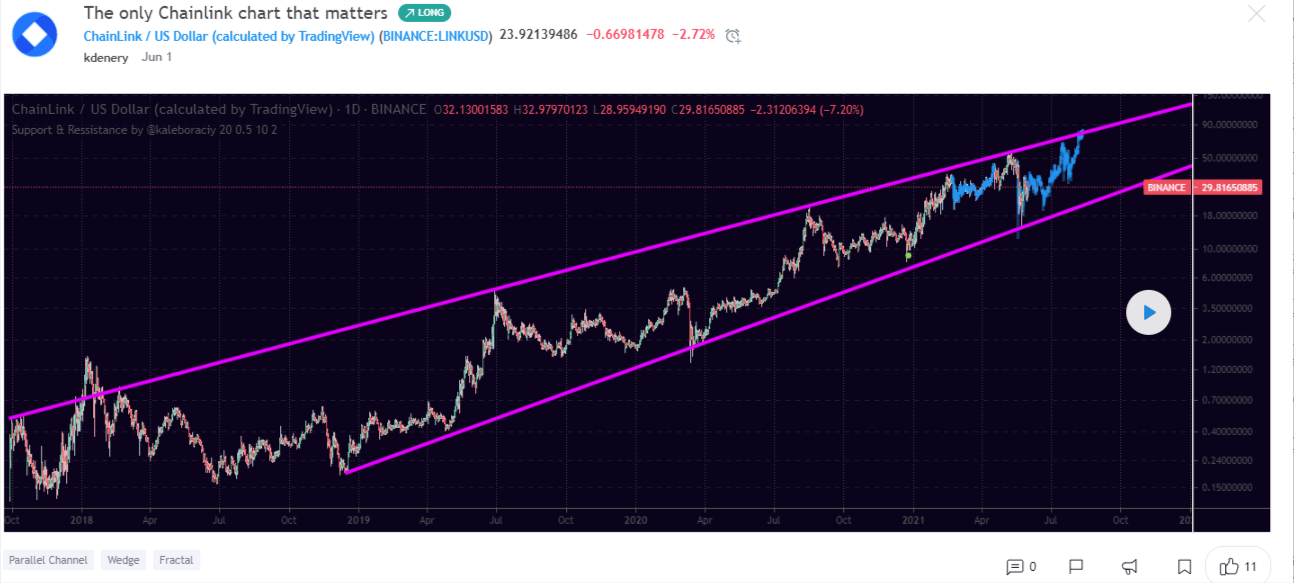
LINK price analysis chart: Source TradingView
Kdenery says everything within this channel is just noise; not until we break above or below it does he expect anything too insane to happen with the price of LINK. It’s not super reassuring that it’s actually a rising wedge instead of an outright parallel channel. However, given that we’re in log view and it’s the all-time chart, he believes that means less than it usually would.
Overall he is bullish on LINK if for no other reason than this chart right here. There is no other chart in crypto that remotely like this, at least as far as he is aware of. Aside from that, if it succeeds in playing all the roles it has the potential to play in global finance, it is also arguably the most fundamentally sound project in all of crypto.
To sum up, the $40 level seems like a very reasonable target if LINK were to stage a breakout to the upside. If the market can pick up steam again, LINK could lead the charge and get back on track during June. Wondering where can I buy Chainlink, learn here!

