Dogecoin is likely to rebound towards recent highs after SpaceX CEO Elon Musk tweeted about DOGE on the moon
DOGE’s value in USD is down 10% on the day but bulls are battling to break higher, even as the rest of the market contends with increased selling pressure over the past 24 hours.
Bitcoin and Ethereum are down 6% and 4% to highlight bear presence, with BTC back in a range around $55.3k. Meanwhile, ETH has retraced from its ATH above $4,200 to trade around $3,900 as of writing.
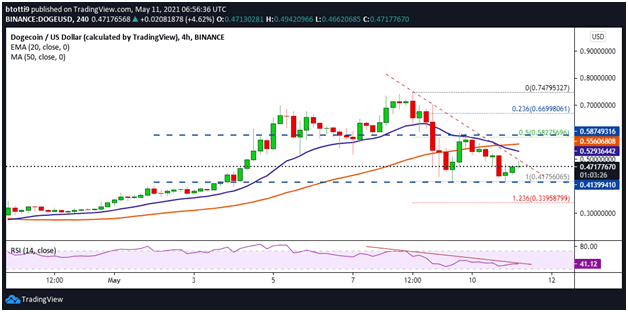
For Dogecoin, the dip sees it stall near $0.50, the main barrier that has capped upward potential over the past 24 hours. Where it trades in the short term might depend on whether or not bulls can break above a bearish trend line on the 4-hour chart. At the time of writing, the DOGE price is around $0.47.
There’s a bullish sentiment around Dogecoin again after SpaceX and Tesla CEO Elon Musk once again tweeted about the meme coin. This is after he appeared on SNL over the weekend, mentioning DOGE in several instances.
SpaceX launching satellite Doge-1 to the moon next year
– Mission paid for in Doge
– 1st crypto in space
– 1st meme in spaceTo the mooooonnn!!https://t.co/xXfjGZVeUW
— Elon Musk (@elonmusk) May 9, 2021
DOGE/USD
Bulls attempted to mount a swift rebound on 9 May and saw prices reach highs of $0.59. The recovery faded, however, as another downturn plunged it below $0.43, with the upside capped by a bearish trend line on the 4-hour chart.
The last 12 hours have nonetheless seen buyers seek a fresh leg up with three consecutive green candles. Keeping the price in an upward trajectory into the daily close would suggest similar aggressive behaviour as seen on May 9 could push DOGE/USD above the descending trend line near $0.50.
From here, new momentum could propel prices to the 20-day EMA ($0.53). The 50 SMA is close by ($0.55), which could open up a retest of the $0.58 (the 50% Fibonacci retracement level of the downswing from $0.75 to $0.41). Other legitimate short-term targets lie near the 23.6% Fib level at $0.66 and $0.70.

DOGE/USD 4-hour chart. Source: TradingView
While bulls have stayed in the game with intraday action, the technical picture suggests bears are likely to strike again. The negative divergence of the RSI is indicating a potential pullback, which is a similar outlook as that of the downward curve of the 20-day EMA.
If the DOGE/USD pair breaks below $0.41, it could correct to the 123.6% Fibonacci retracement level at $0.33.

