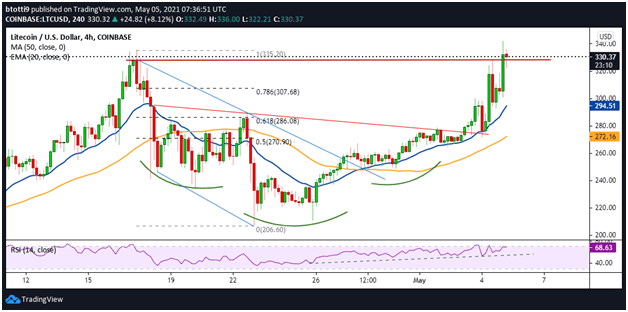
LTC/USD rallied to an intraday high of $342, the highest price level for Litecoin in nearly three and half years
Litecoin broke past the $300 price level to reach a 3-year high of $342 amid increased buying pressure for the “digital silver”.
With bulls eager to break higher, it’s likely upward momentum will push Litecoin’s price towards the 2017 peak of $375. As of writing, the LTC/USD pair is trading around $323 on Coinbase- 14% up on the day and 31% in profit over the past week.
The cryptocurrency is also doing well against the more illustrious BTC, with the pair up 17% over the past 24 hours as more money flows into the altcoin market.
Crypto analyst Michael Van de Poppe has suggested that several alts might just be at the beginning of a major rally against Bitcoin, an outlook that could favour further gains for the LTC/USD pair.
A pseudonymous trader has highlighted why LTC will soon go to a new all-time high: multiple indicators have flipped bullish on higher time frames.
$LTC / $BTC Super bullish on Litecoin as it has multiple indicators crossing bullish on a high time frame (HTF) for the first time in three years.
– MACD Signal crossover
– MACD Histogram crossed baseline
– RSI in bull territory
– Bollinger Bands breakout#Litecoin #bitcoin pic.twitter.com/hctFp22rBy— CB (@cryptobolic_) May 5, 2021
LTC/USD price outlook
Litecoin broke higher following the appearance of an inverted head and shoulders pattern on the 4-hour chart.
The upside saw bulls breach the macro resistance level at the 0.618 Fib level ($286) before a minor dip occurred on 4 May. But after exploding upwards, bulls rallied past the 0.786 barrier ($307) and weathered some sell-off pressure to break to a new multi-year high of $342.
Bulls are now attempting to keep prices above the resistance line at $328.

LTC/USD 4-hour chart. Source: TradingView
The technical outlook for LTC is bullish, with the price above the 20-day EMA and 50 SMA. The RSI on the 4-hour chart is also trending with a positive divergence near 70 to suggest bulls have room for further movement.
If the upward trajectory remains in effect, LTC/USD could march to its current all-time peak of $375. Above that, a legitimate target lies at the flat $400 level, with a potential for further upsides towards $500 in the short term.
In case of a short-term pullback, the LTC price will likely drop to the initial support at the 0.786 Fib level. The bullish view will remain intact though if bulls rebound off the $300 level or the 20-day EMA ($294). The outlook will flip negative if the price breaks lower past the 50 SMA ($272).

