Polkadot (DOT) managed to outperform the market by posting double-digit gains as its price inches towards $10
Polkadot has, after a major price pump, started descending rapidly as a response to Bitcoin’s move down. However, DOT bulls managed to take the control back from the bears and resumed the move up, pushing the price up by over 10% in the past 24 hours.
DOT’s overall outlook is extremely bullish due to its fundamentals. For instance, Binance annouced on 23 December they will support the Polkadot project with $10 million of funding. On top of that, Binance has changed the ETH/BUSD pair on the main page with the DOT/BUSD pair at one point, giving Polkadot a lot more exposure.
After the good news came out, technicals developed in sync with the fundamentals and drove DOT’s price further up. DOT managed to lose 0.69% week-over-week; when compared to other cryptocurrencies, BTC scored a loss of 16.66%, while ETH managed to lose 13.97% over the same period.
At the time of writing, DOT is trading for $9.20, which represents a price increase of 95.88% when compared to the previous month’s value.
DOT/USD
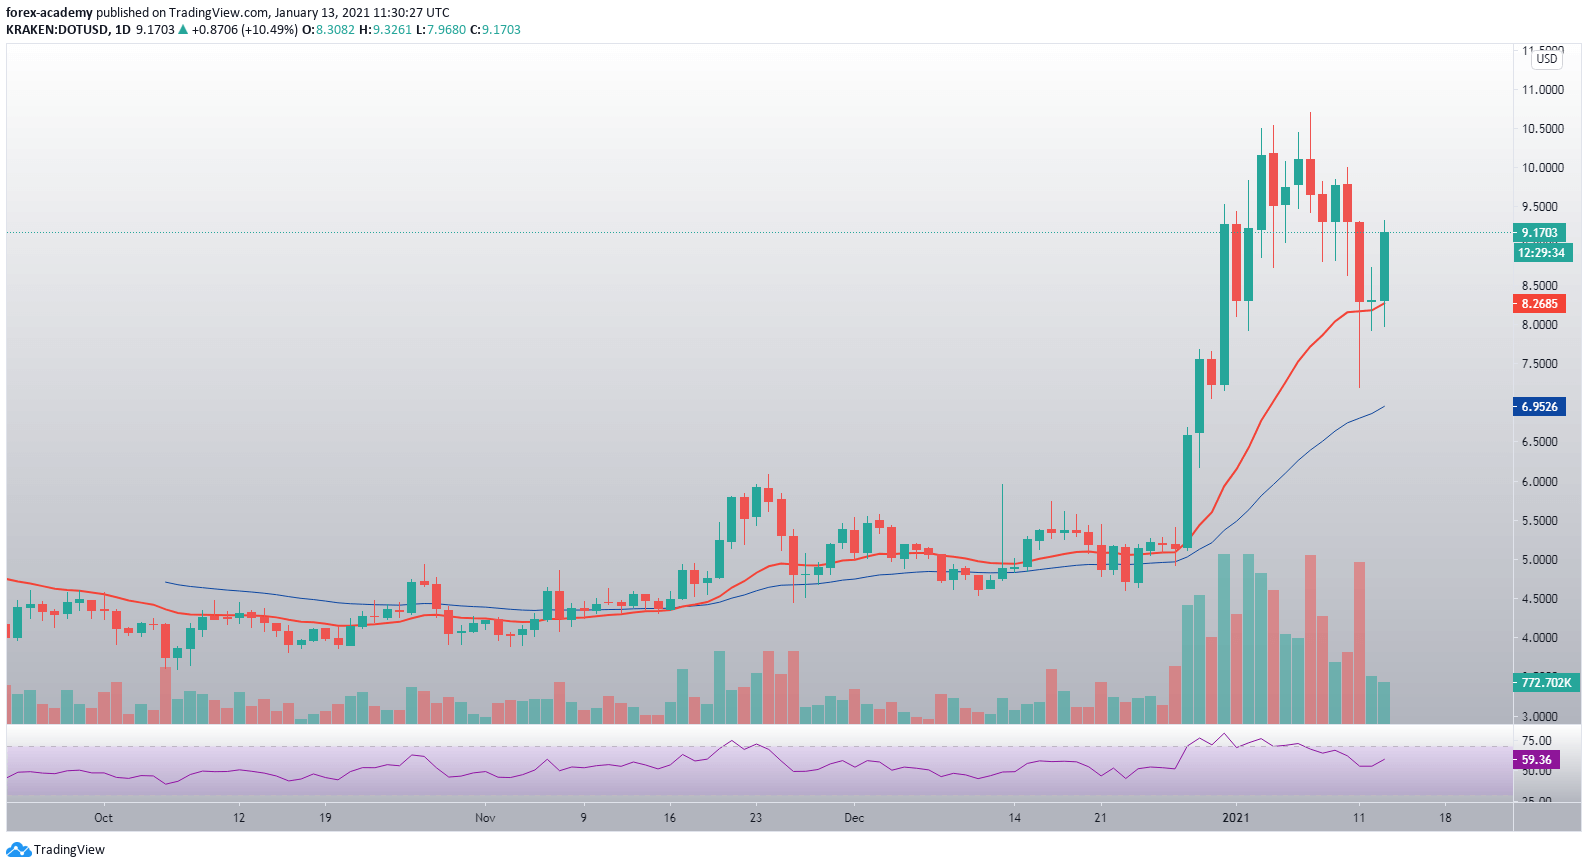
Polkadot (DOT) broke out of its long-term range on 28 December, with its price pushing from a little above $5 to over $10. However, Bitcoin’s downturn ultimately caused a pullback in DOT/USD, which lasted for a little less than a week. Today, however, after finding support on the 21-day moving average and creating a Doji candle right above the EMA, Polkadot pushed back towards $10.
DOT faces a strong resistance zone after $9.30 and all up to a little above $10. On the other hand, the 21-day moving average has shown to be an immense support level.
 DOT/USD daily price chart. Source: TradingView
DOT’s RSI on the daily timeframe has slowly left the overbought territory after it reached $10. Its RSI currently neutral, with a value of 59.19.
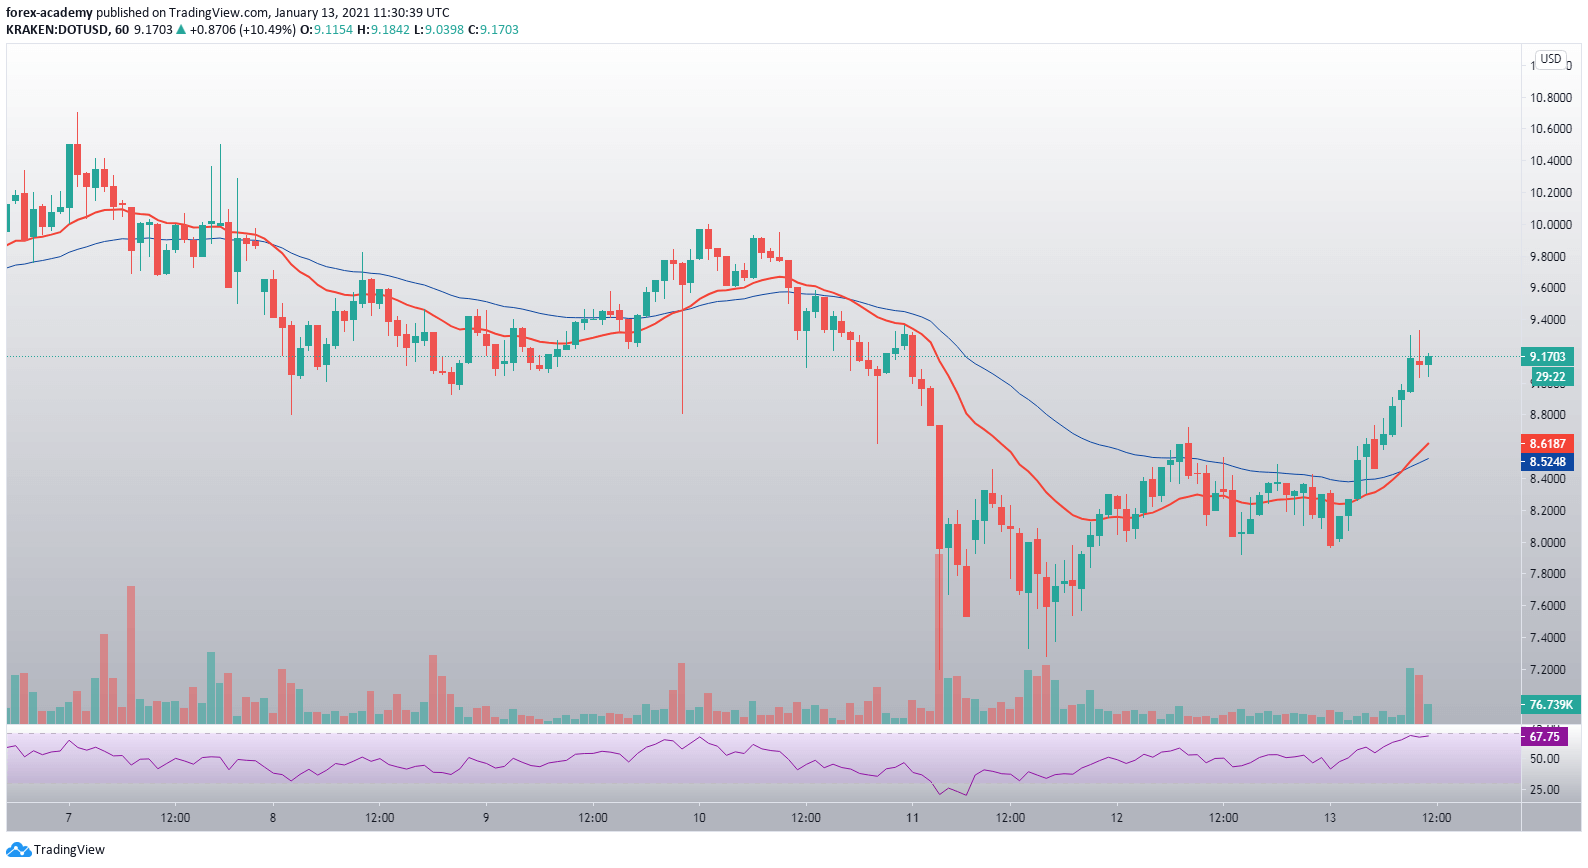
 DOT/USD 1-hour chart. Source: TradingView
DOT’s hourly timeframe is slightly less important when compared to the daily, but can still explain a lot of things. We can clearly see how the price responded to both the 21-hour and 50-hour levels. On the other hand, we can also see the 21-hour EMA crossing over the 50-hour EMA, posting a bullish signal.

