Sell-off pressure has seen DOT/USD price drop nearly 16% since touching a new high of $6.79
The price of sharded protocol platform Polkadot’s token has dropped nearly 16% as of writing as increased sell-off pressure shreds the bullish momentum seen over the last seven days.
With trading support added on major crypto exchange Kraken this week, the price of DOT against the US dollar shot from $3.00 to hit new highs above $5.40. The trend continued on Thursday as the blockchain token rose more than 200% over five days to see it climb to 6th place by market cap according to data from CoinGecko.
The bullish momentum was also likely linked to the blockchain platform’s token split on the ratio of 1:100. On August 21, Polkadot redenominated its DOT token at block 1,248,328, resulting in new tokens 100X smaller than the old units.
The New Dot token is currently trading lower on the daily and hourly charts amid shrinking buy volumes. As per data on CoinMarketCap, the DOT/USD trading pair has dipped by more than 15% in the last 24 hours and is changing hands around $5.60 as of Friday, August 28, 07.04 UTC.
DOT/USD price hits resistance
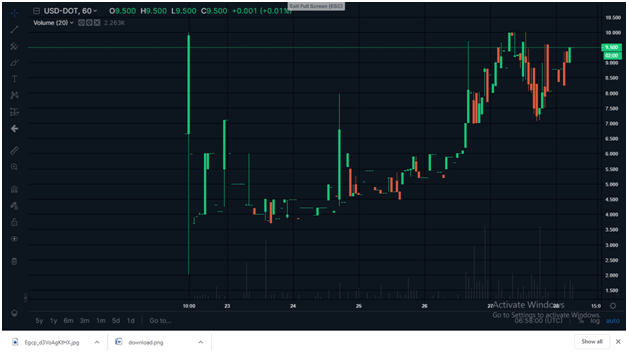
DOT/USD is dropping fast after hitting resistance around $6.79. In the past 48 hours, bullish momentum likely triggered by expanding buy volumes, pushed prices to the new peak. The token even spiked to $9.50 on Bittrex before dropping to $7.00.

However, the DOT/USD pair has over the past hours printed a series of lower highs and higher lows, thanks mainly to a general lack of decisiveness in the crypto market. This follows Bitcoin’s slip to $11,100 lows as bulls struggle to clear resistance around $11,500.

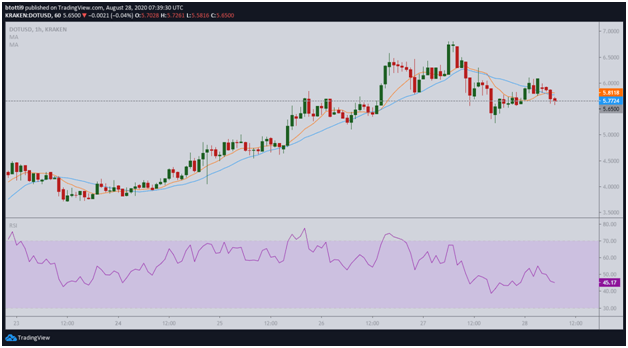
A look at DOT/USD on the hourly charts shows that price has crossed under both the 20-day and 10-day simple moving averages at $58.17 and $57.23. The RSI is suggesting a bearish picture short term as it ticks lower at 45.17. The MACD has formed a bearish divergence to suggest the downturn might extend for the next few sessions.
Immediate support is at $5.20 and below that, $4.70. If these areas break, DOT/USD could settle for an extended sideways trading phase around $4.00-$5.00.
According to data on CoinGecko, Polkadot has a market cap of $5.6 billion, the 6th largest behind Bitcoin, Ethereum, Ripple and ChainLink.

